Volatility Harvesting

An intriguing read, “Volatility Harvesting: Extracting Return From Randomness” covering a range of topics including volatility pumping, volatility harvesting, Parrondo’s Paradox, and Shannon’s Demon.

ABSTRACT. Studying Binomial as well as Normal return dynamics in discrete time, we explain how, in zero-growth environments, trading strategies can be found which generate exponential growth of wealth. We include numerical results for simulated and real world processes confirming the observed phenomena while also highlighting implicit risks.

Volatility as an Asset Class

A nice overview of the cyclical nature of volatility trading by Jonathan Kinlay entitled, “The Case for Volatility as an Asset Class”. For options traders, the idea of volatility as an asset class is taken for granted. For most others, it’s likely they’ve never given these strategies much of a thought. That’s unfortunate given the excellent diversification (i.e. uncorrelated returns) provided by most volatility strategies.

A few highlights from the article:

So an investment strategy than [sic] seeks to exploit volatility trends is relying upon one of the most consistent features of any asset process we know of.

A long volatility fund might lose money month after month for an entire year, and with it investors and AUM, before seeing the kind of payoff that made such investment torture worthwhile.

The previous observation, while well known, is further confirmed by the recent news that, “A ‘Black Swan’ Fund Makes $1 Billion”.

Conversely, stories about managers of short volatility funds showing superb performance, only to blow up spectacularly when volatility eventually explodes, are legion in this field.

The moral is simple: one cannot afford to be either all-long, or all-short volatility. The fund must run a long/short book, buying cheap Gamma and selling expensive Theta wherever possible, and changing the net volatility exposure of the portfolio dynamically, to suit current market conditions.

Systematic Scalping: A reference approach to daily gamma scalping

As a follow-up to my previous article on “Gamma Scalping Cypress Semiconductor”, I take a look at an alternative approach to gamma scalping. The initial article elicited many questions regarding the timing or triggers that prompt delta hedging. In this article I compare our initial, ad lib hedging results with a more systematic strategy that hedges (i.e. neutralizes) the position delta once-a-day at the closing price. This more systematic approach will serve as a reference to evaluate the efficacy of the ad lib approach to hedging.

To recap the results from the previous example paper trading in CY, the end result was that after two months of gamma scalping, the position paid for itself, but only made a very small profit. While there were several opportunities along the way to take a fairly significant profit and close the position, the intention from the outset was to hold the position through to expiration to explore all aspects of the trading process.

Delta hedging is theoretically a continuous process. In practice, it typically happens far less often. It’s not surprising then that this analysis shows that overall profitability is highly dependent upon the delta hedging strategy employed versus the implied volatility paid for the option position.

The initial long option position was entered into two days prior to an earnings announcement. The timing was purely coincidental, as this was a teaching exercise, but it did provide an interesting set of circumstances to explore the strategy. Given the timing, I was concerned that volatility and therefore option prices were inflated, meaning that the 0.44 implied volatility would be simply too high of a price. Ex post, the realized volatility for the two-month period was 0.315, showing that concern was well justified.

The result from the systematic daily hedging strategy was a loss of $2455, considerably worse than the ad lib hedging strategy which managed a slight profit of $133. Nearly all the blame for that loss can be attributed to simply paying too high of an implied volatility to establish the long option position. If instead of paying a 0.44 implied volatility, I had paid a 0.315 implied volatility, which matches the realized volatility for that period, the call options would have only cost $0.72 instead of $1.00. The result from daily hedging at this lower volatility would have then been a net loss of $4, which is basically breakeven.

In summary, what was shown from this ex post analysis is that I was rightly concerned that option prices (i.e. implied volatility) were high prior to earnings. I also found that for this particular example my original ad lib hedging strategy, which seemed somewhat disappointing in only generating a small profit, actually generated almost $2600 of additional value relative to the reference daily hedging strategy. In other words, the ad lib hedging compensated for paying over 25% too much for the initial options position. Simply put, that’s a huge win!

Systematic Daily Hedging
DatePrice (CY)DaysOpt. ValueOpt. DeltaHedgeDaily Adj.
2015-01-2014.01591.00269050.5404727-5400-5400
2015-01-2114.16581.07696860.5641687-5600-200
2015-01-2214.82571.47422680.6639539-6600-1000
2015-01-2315.26561.77151200.7241128-7200-600
2015-01-2615.27531.75424450.7291968-7300-100
2015-01-2715.17521.67356420.7173215-7200100
2015-01-2814.95511.51033680.6879020-6900300
2015-01-2915.20501.67820960.7240202-7200-300
2015-01-3014.73491.34443710.6569752-6600600
2015-02-0214.26461.02482980.5808125-5800800
2015-02-0314.51451.16581950.6243123-6200-400
2015-02-0414.50441.14986110.6232312-62000
2015-02-0514.22430.97227100.5739954-5700500
2015-02-0614.67421.23877160.6537778-6500-800
2015-02-0914.32390.98976730.5934679-5900600
2015-02-1014.73381.23832330.6687060-6700-800
2015-02-1114.70371.20802520.6647852-6600100
2015-02-1214.75361.23111830.6750438-6800-200
2015-02-1314.76351.22740370.6783712-68000
2015-02-1714.65311.10994160.6644573-6600200
2015-02-1814.80301.20068600.6950144-7000-400
2015-02-1914.87291.23873190.7103890-7100-100
2015-02-2014.95281.28515450.7277306-7300-200
2015-02-2314.66251.04592310.6785185-6800500
2015-02-2414.89241.19566140.7285719-7300-500
2015-02-2514.66231.02081570.6836736-6800500
2015-02-2614.81221.11337560.7191333-7200-400
2015-02-2714.75211.05777380.7097611-7100100
2015-03-0215.40181.53082300.8483386-8500-1400
2015-03-0315.16171.32038000.8134503-8100400
2015-03-0415.20161.34161180.8272931-8300-200
2015-03-0515.50151.58799120.8830361-8800-500
2015-03-0615.10141.23526230.8225895-8200600
2015-03-0915.51111.56073110.9166819-9200-1000
2015-03-1015.19101.26329300.8770427-8800400
2015-03-1115.5191.54423400.9358196-9400-600
2015-03-1215.6881.69893790.9621082-9600-200
2015-03-1315.9571.95790520.9851354-9900-300
2015-03-1615.7141.71288480.9942528-99000
2015-03-1715.5431.54196310.9958324-10000-100
2015-03-1815.2621.26136540.9961376-100000
2015-03-1915.4211.42038460.9999871-100000
2015-03-2015.7001.70000001.0000000-100000

Love Gamma? Where to find the highest gamma to theta ratio

If you’re an options traders that likes to get a lot of bang for your buck, here are two things to look for in an underlying security that can help maximize the ratio of gamma to theta in your options position.

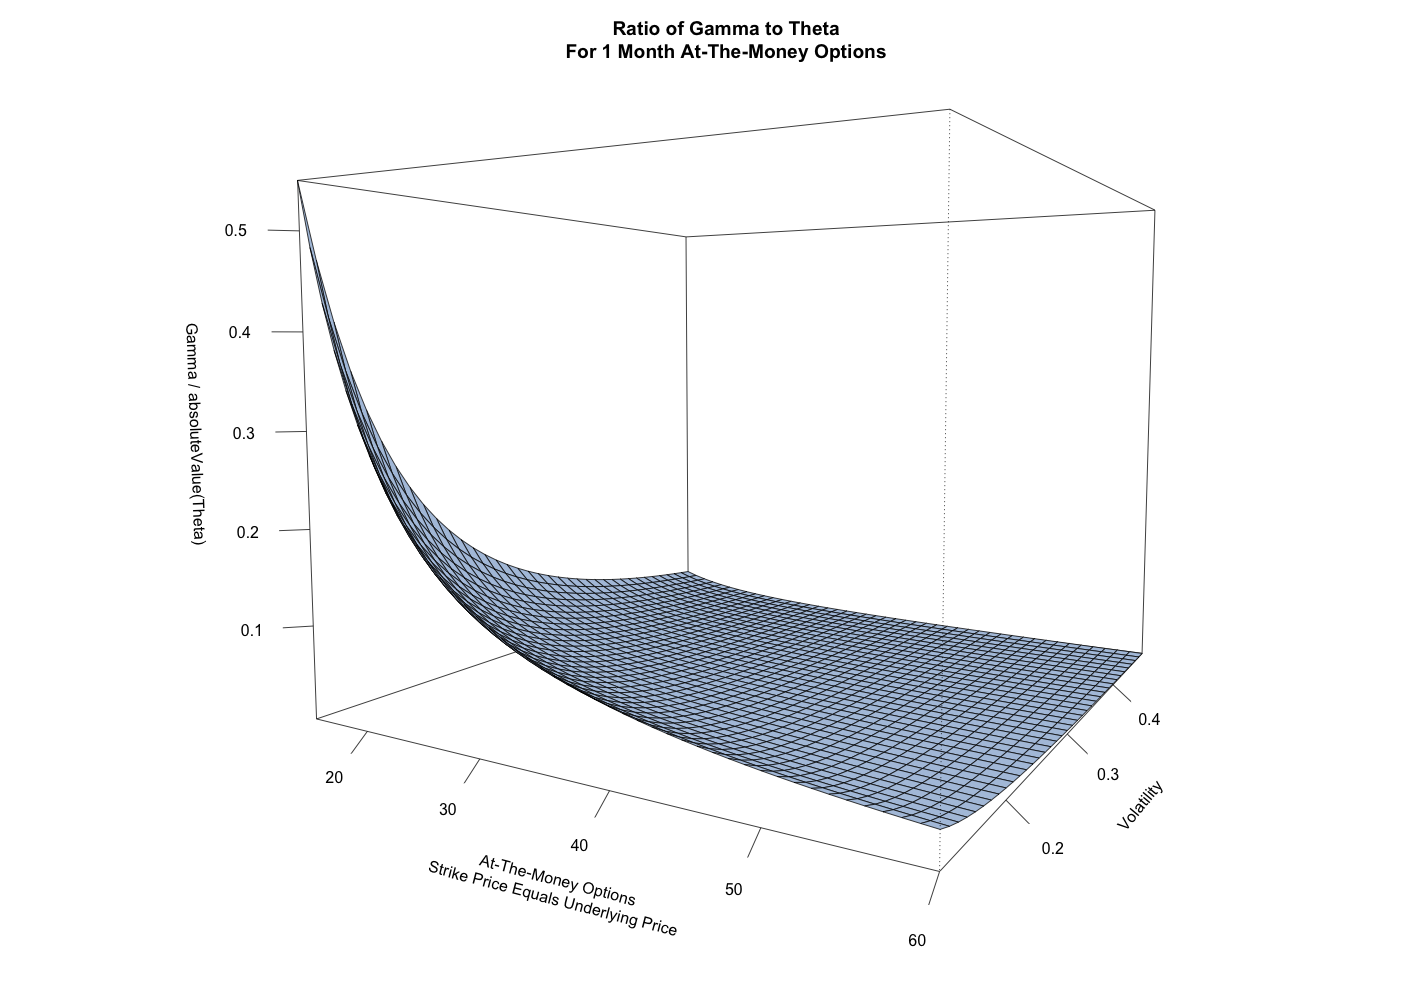
This 3-dimensional surface illustrates the way in which underlying price and volatility affect the ratio of gamma to theta for at-the-money (ATM) options. What you see is that for a call option with one month left to expiration, the at-the-money option for a lower priced underlying will have a higher gamma to theta ratio. You also see that lower volatility at-the-money options have a higher gamma to theta ratio. Combining these two characteristics, the lower the underlying price and the lower the volatility, the higher the gamma to theta ratio for the at-the-money option.

Gamma to Theta Ratio

There are a couple of important details that should be clarified in this chart. Since theta is always negative, the absolute value of theta has been used for these calculations because this results in a ratio that is far more intuitive to interpret. Theta also is calculated here in cents, not dollars, therefore the magnitude of the ratio may initially appear smaller than some are used to seeing. Additionally, this surface only displays values for at-the-money options, so for the axis lying in the foreground of the chart, the ratio is for a 20 strike option with the underlying price at $20, a 40 strike option with the underlying price at $40, etc..

So if you’re a long gamma trader trying to maximize your gamma to theta ratio, look for low priced, low volatility underlying securities to load up on “cheap” gamma and then hope for that pop in volatility.

When To Hedge Delta: Why There's No Good Answer

In the course of explaining delta-neutral trading strategies, the question that inevitably arises is when to hedge the net position delta. It’s a great question, but a question with no good (i.e. definite) answer.

For long gamma strategies, gamma scalping is a means of paying for theta and generating profit. In this context, the trader is metaphorically trying to harvest volatility from the market. The convex curvature of a long gamma position allows the trader to buy low and sell high. The question is how to best maximize that process, thereby buying as low and selling as high as possible, while not also missing any smaller intra-day scalps.

Short gamma strategies are the opposite side of the same coin, whereby hedging is the cost of maintaining risk parameters. The trader is effectively forced to trade counter to the market (i.e. buy high, sell low) in order to keep position risk in check. In this context, the trader would ideally trade as little as possible, thereby minimizing any potential negative scalping.

Digging into the academic literature associated with option pricing models reveals the expectation that an option position is continuously hedged. So the answer to the initial question, to the extent that there is one, is that an option position should be hedging continuously. Whether continuous hedging is even possible is highly debatable. Regardless of the theoretical underpinnings, the reality is that traders hedge their positions far less regularly.

Researchers have investigated the impact of non-continuous hedging and have found that less frequent hedging results in a range of possible profit and loss scenarios. The standard deviation of these scenarios tends to decrease by half as the frequency of hedging is increased four-fold. In other words, the less frequent the hedging, the wider the range of possible profit and loss scenarios.

Research into non-continuous hedging has tended to focus on hedging at reduced, but regular time intervals with a constant, known volatility. Traders have employed hedging strategies ranging from simple ad hoc approaches to various regimented strategies that hedge at regular time intervals (e.g. daily, hourly), are triggered based upon net position delta, or are based upon the expected daily range based upon implied volatility and the Rule of 16.

Perhaps a more interesting question that might help define a hedging strategy is whether there exists any additional underlying volatility not fully represented in historical volatility calculations. The most typical representation of historical volatility is as the annualized standard deviation of log-normal daily price returns. The problem is that this model only utilizes daily closing prices, ignoring the intra-day range as represented by the daily high and low prices. Various models, such as the Garman-Klass volatility estimator, have been constructed that attempt to better estimate historical volatility, yet the close-close model remains ubiquitous.
Daily Range vs Historical Volatility

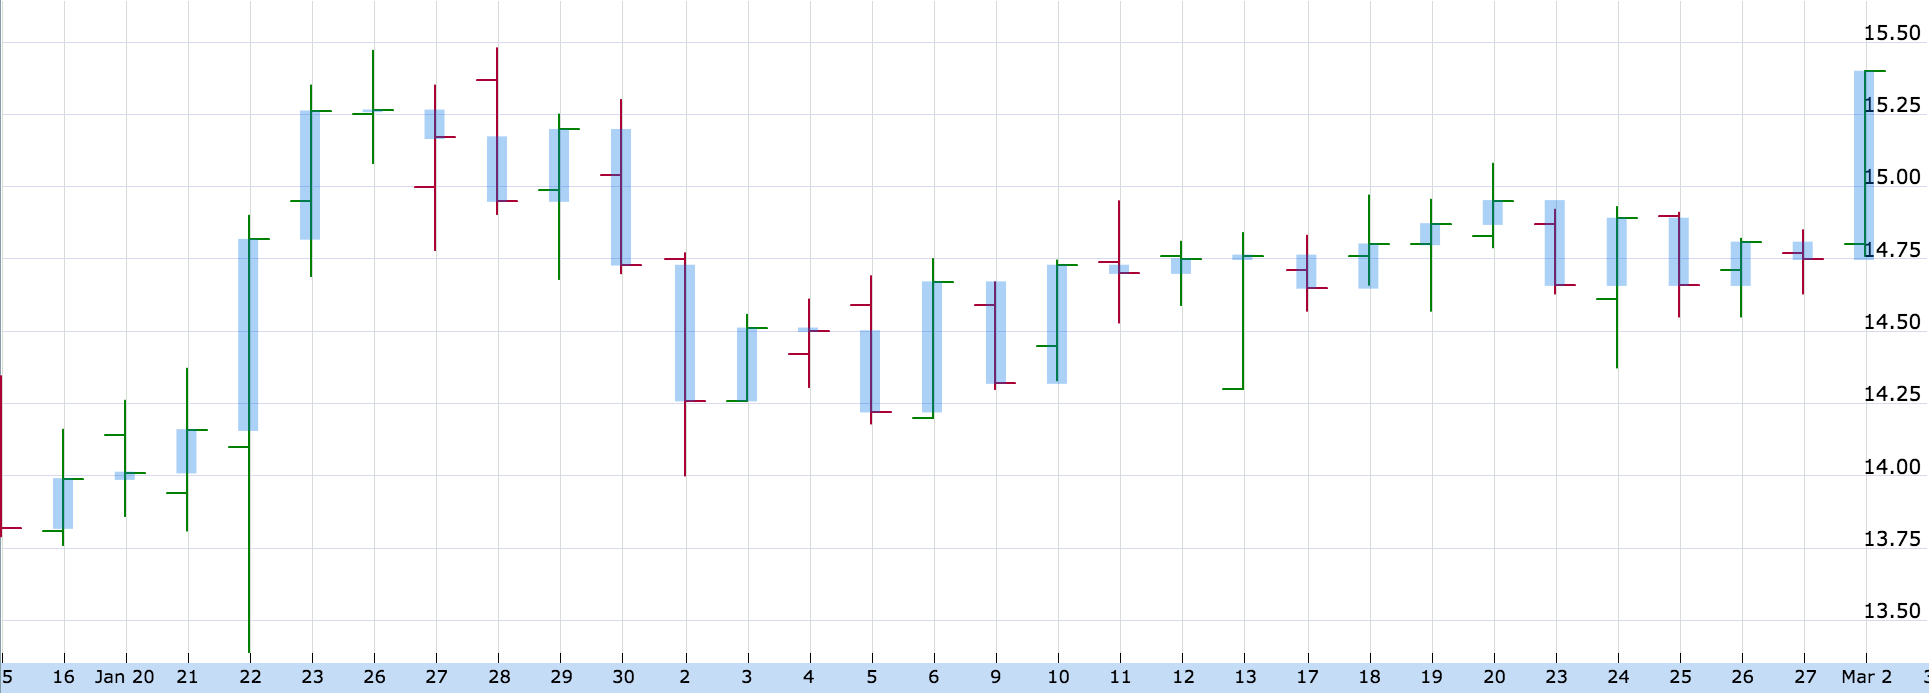
Taking a look at the price chart for one security sheds some light on the type of movement that might not be fully reflected in the standard close to close historical volatility calculation. This chart shows a typical daily representation of open, high, low, and closing prices. The blue bar overlaying each days price range has been added to reflect the daily change in price that would ordinarily be represented by historical volatility. The areas lying outside of the blue bar represent movement that’s not being reflected in the calculation. For a few of the days, the difference is insignificant, but for many of the days, there’s quite a bit of difference.

One of the most obvious instances of this difference is on January 22nd. The underlying security opens slightly down at $14.10, continues down, hitting an intraday low of $13.39, turns around and rallies to an intraday high of $14.90, before eventually closing the day at $14.82. The close to close change of $0.66 represents only 43.7% of the high-low range. While the magnitude of the volatility on this particular day was fairly exceptional, there are other days that exhibit a similar back and forth trading range that’s simply not adequately captured by the historical volatility calculation.

Identifying securities where historical volatility is not adequately capturing the true intraday trading range can help define both the option trading strategy and the hedging strategy. In the end, there are many possible hedging strategies, but ideally the hedging strategy will be tailored to the option position and the trading characteristics of the underlying security.