Theta: A Detailed Look at the Decay of Option Time Value

Of all the option sensitivities, or Greeks, there is likely none that is obsessed over by beginning options traders as much as theta. It seems that this obsession largely stems from a fear that they might be the sucker that gets stuck owning some rotting, soon-to-be worthless option contract. Given all this obsessing, one might expect a better understanding of theta. Unfortunately, many beginning and experienced option traders alike fall prey to generalities concerning the nature of theta. Hopefully this article will provide some insight into the specifics of time decay.

Standardized options exist for a finite period of time. As time passes, and the life of an option draws shorter, the potential for various profitable and unprofitable eventualities decreases for the underlying security. As an option is a financial contract with an asymmetric risk/reward profile, in practice this means that the potential for various profitable events decreases for the option. Therefore, as time passes, an option’s time value decreases. The change in an option’s value resulting from the passage of time, from one day to the next, is known as theta, and it is always negative.

While the trajectory of theta might be clear, the actual rate of change can leave some traders baffled. The most common general misconception is that an option’s theta always increases in magnitude over time. Thereby decaying at a faster and faster rate. While this is true for at-the-money options, it doesn’t hold for in-the-money or out-of-the-money options. After illustrating the complexities of theta, or time value decay, it should be clear what really happens.

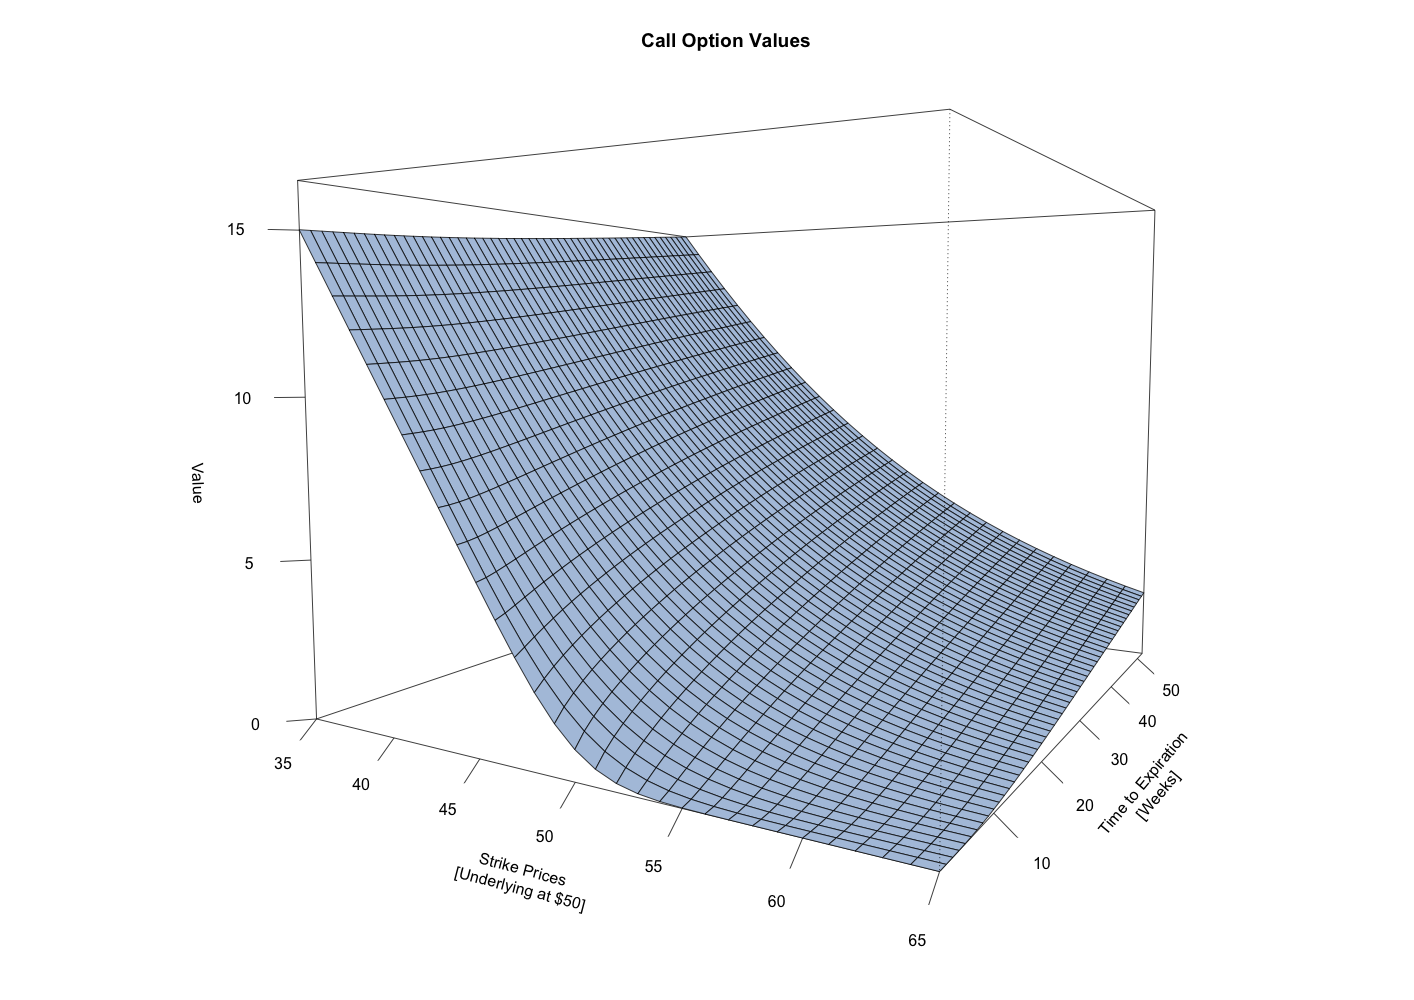
Call Option Value

This first chart shows a 3-dimensional surface depicting the value of call options with varying strike prices and with varying times to expiration. For all of these call options, the underlying security is priced at $50. One general observation is that the in-the-money options, those with a strike price less than $50, have a greater value commensurate with the degree to which they’re in-the-money. The out-of-the-money options, those with a strike price greater than $50, have a lesser value, again commensurate with the degree to which they’re out-of-the-money. Another general observation is that for all the options, regardless of whether they are in, at, or out-of-the-money, their value decreases as the time to expiration decreases.

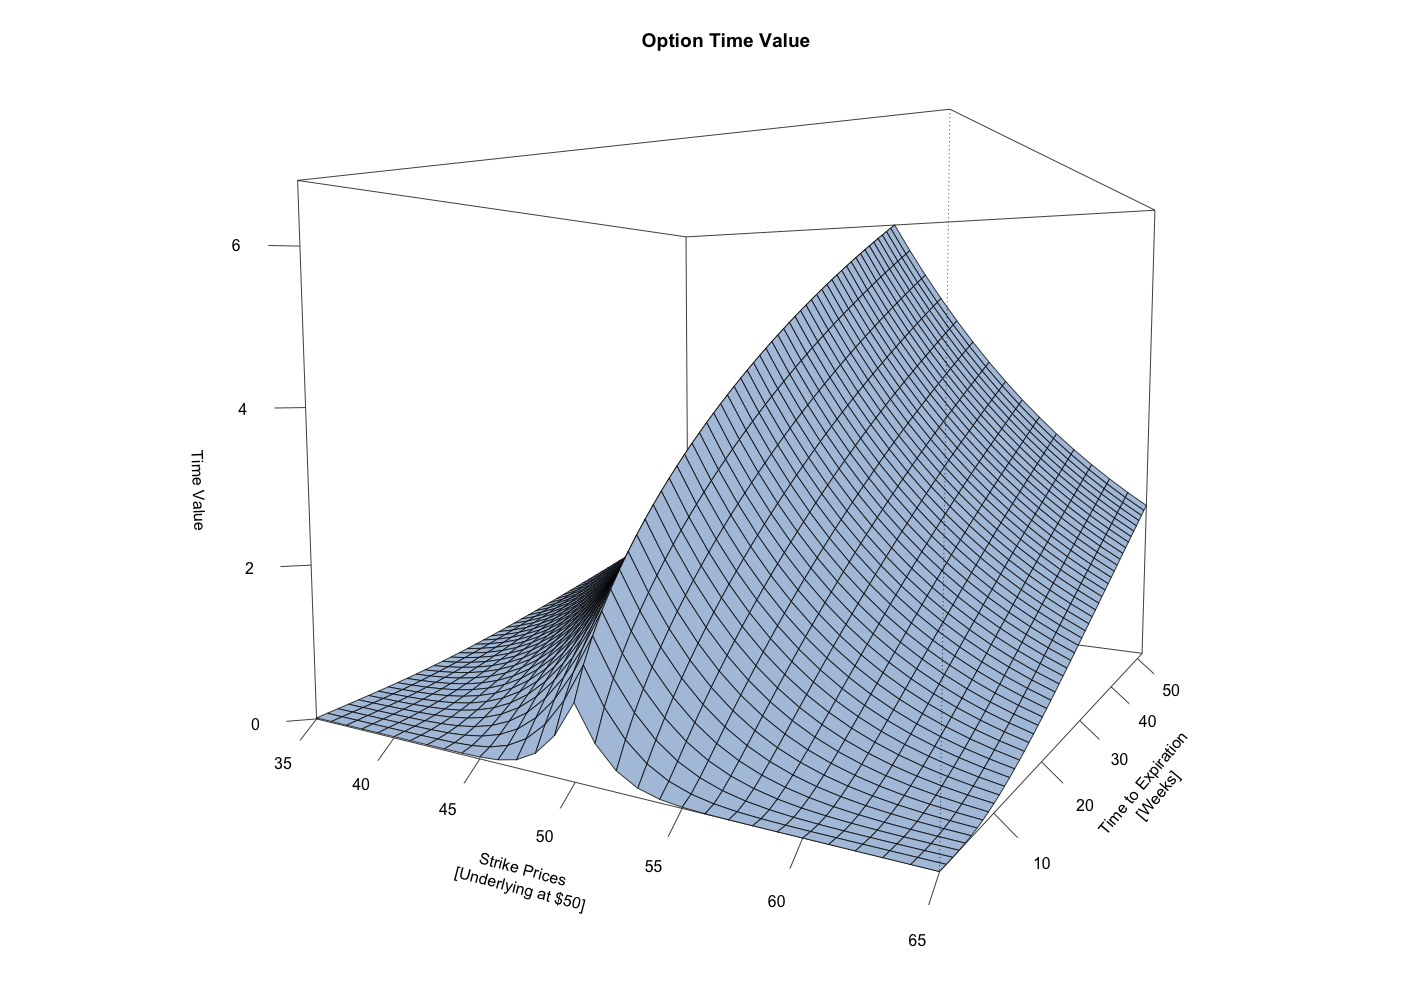
Call Option Time Value

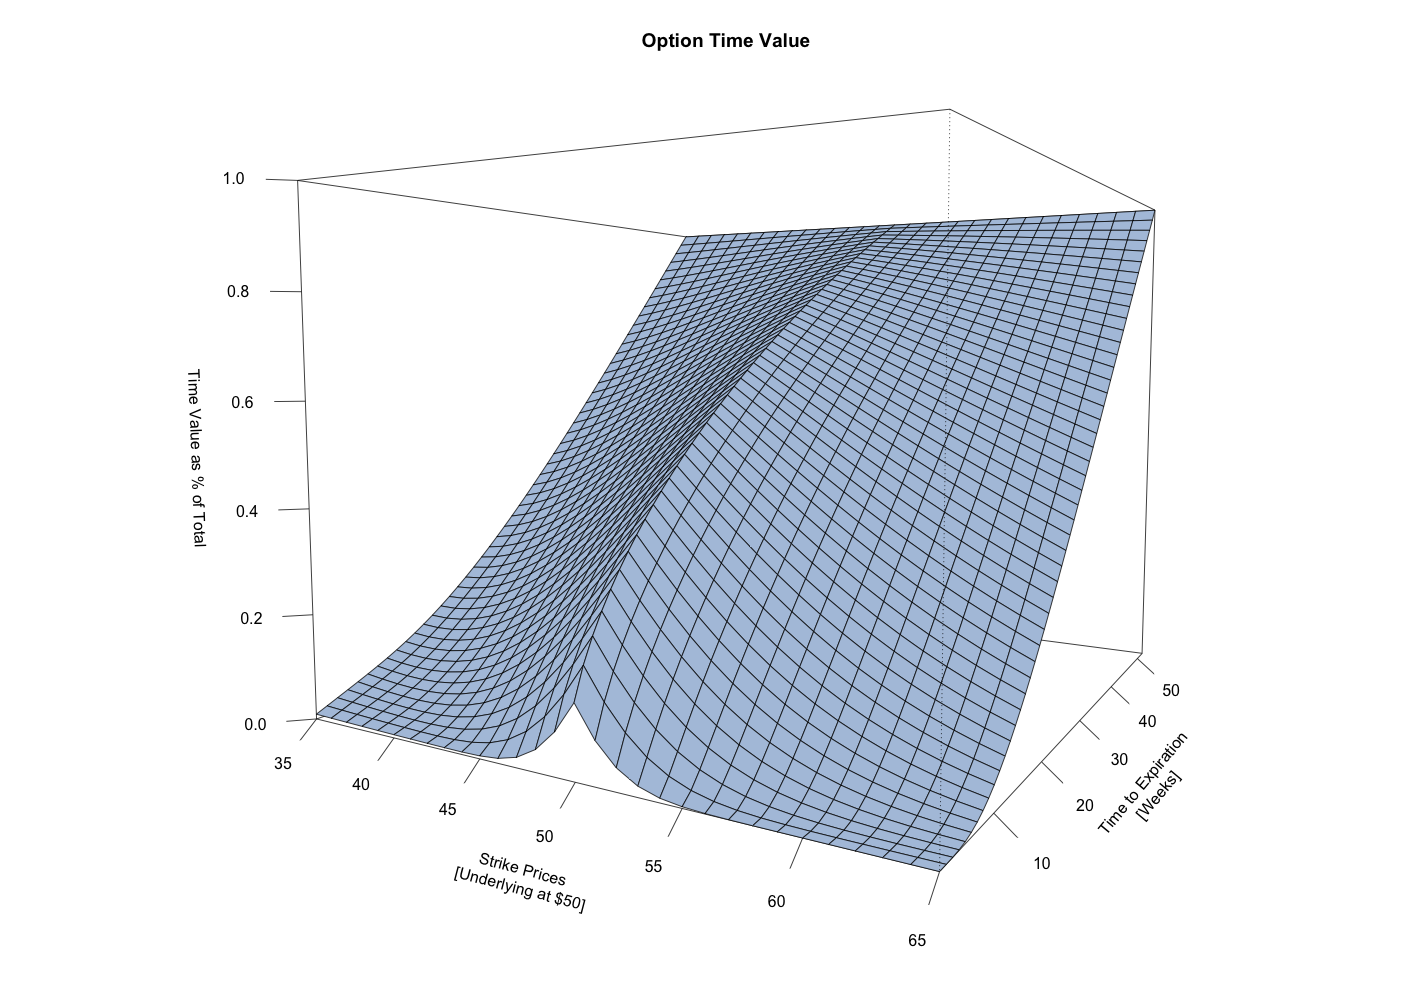
The reason the in-the-money options have higher values than the out-of-the-money options is that their values are composed of both time value and intrinsic value, whereas the value of the out-of-the-money options are composed of only time value. Intrinsic value describes the degree to which an option is in-the-money. This second chart shows the same 3-dimensional surface, but with the intrinsic value removed from the value of each call option. This shows that the time value is fairly symmetric on either side of the at-the-money options and that the at-the-money options have the most time value for a given time to expiration. It also shows the typical decline in time value as the time to expiration decreases.

What’s also readily apparent is the fact that for at-the-money options, time value decreases at an increasing rate as the time to expiration decreases. That is the “expected” behavior for theta. However, the change in time value for the in-the-money and out-of-the-money options show quite a different pattern of decay. The decrease in time value is characterized by a fairly linear rate of change with a decrease in the rate of decay over the last few weeks to expiration. So where the at-the-money options decay at an ever faster rate into expiration, the decay of the in-the-money and out-of-the-money options level out, as there is little time value left to decay.

Option Theta Decay

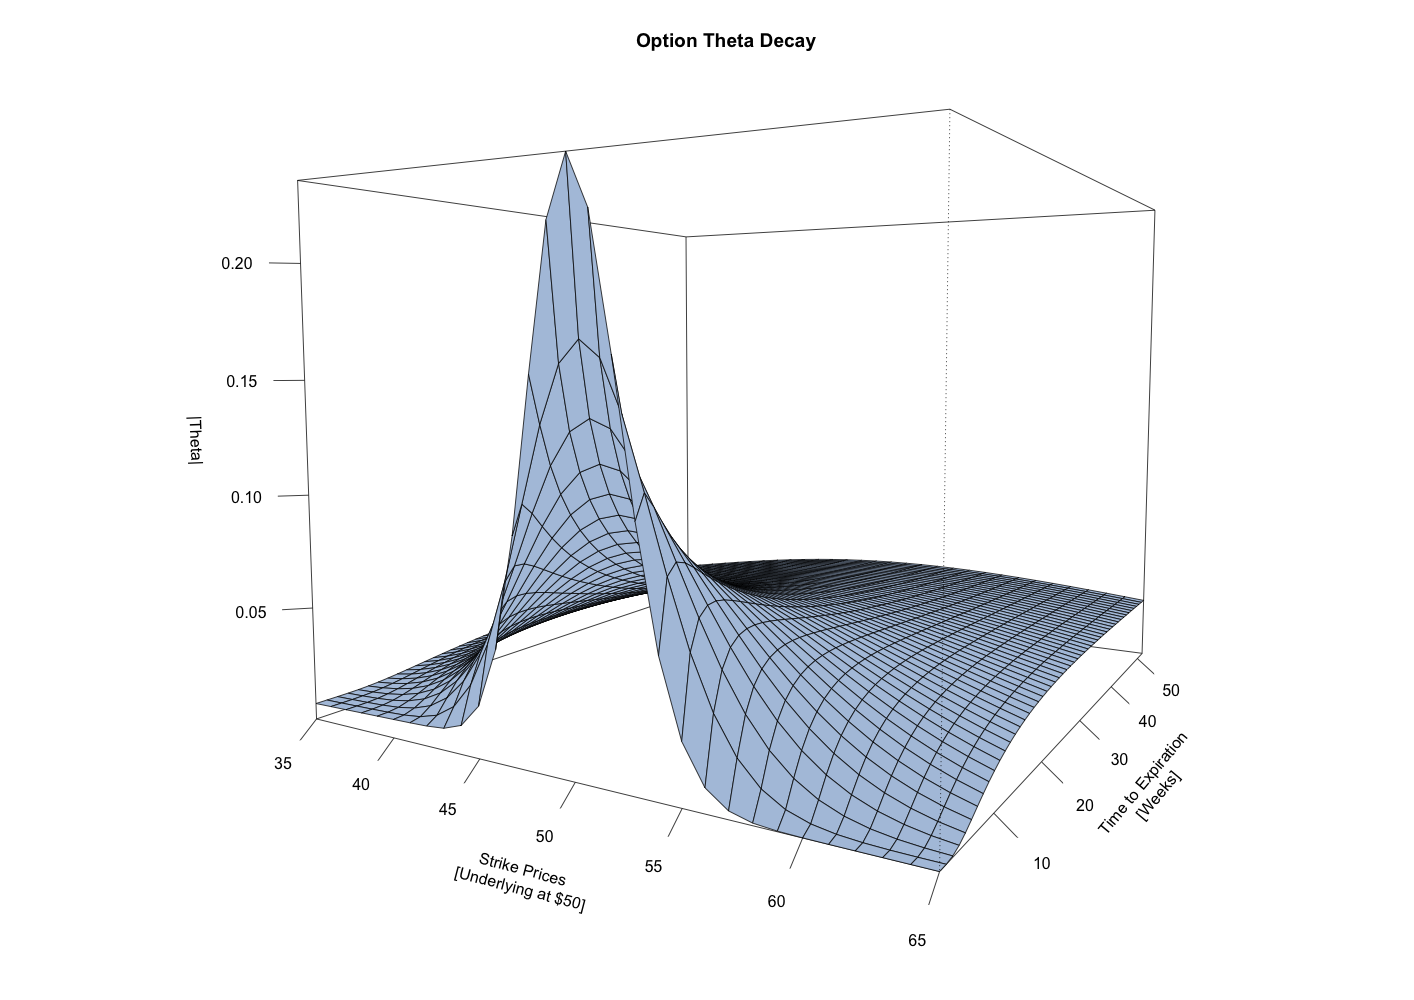
The difference in behavior can be seen even more clearly from this next chart. It shows a 3-dimensional surface displaying the absolute value of theta, or time value decay, for the corresponding call options. (Theta is always a negative value, but for the purpose of comparing magnitudes across the surface, using the absolute value of theta tends to be more intuitive.) Here, the at-the-money options exhibit a near exponential increase in theta as expiration nears. Whereas the in-the-money and out-of-the-money options exhibit a fairly constant rate of theta that gradually decreases over the last few weeks into expiration.

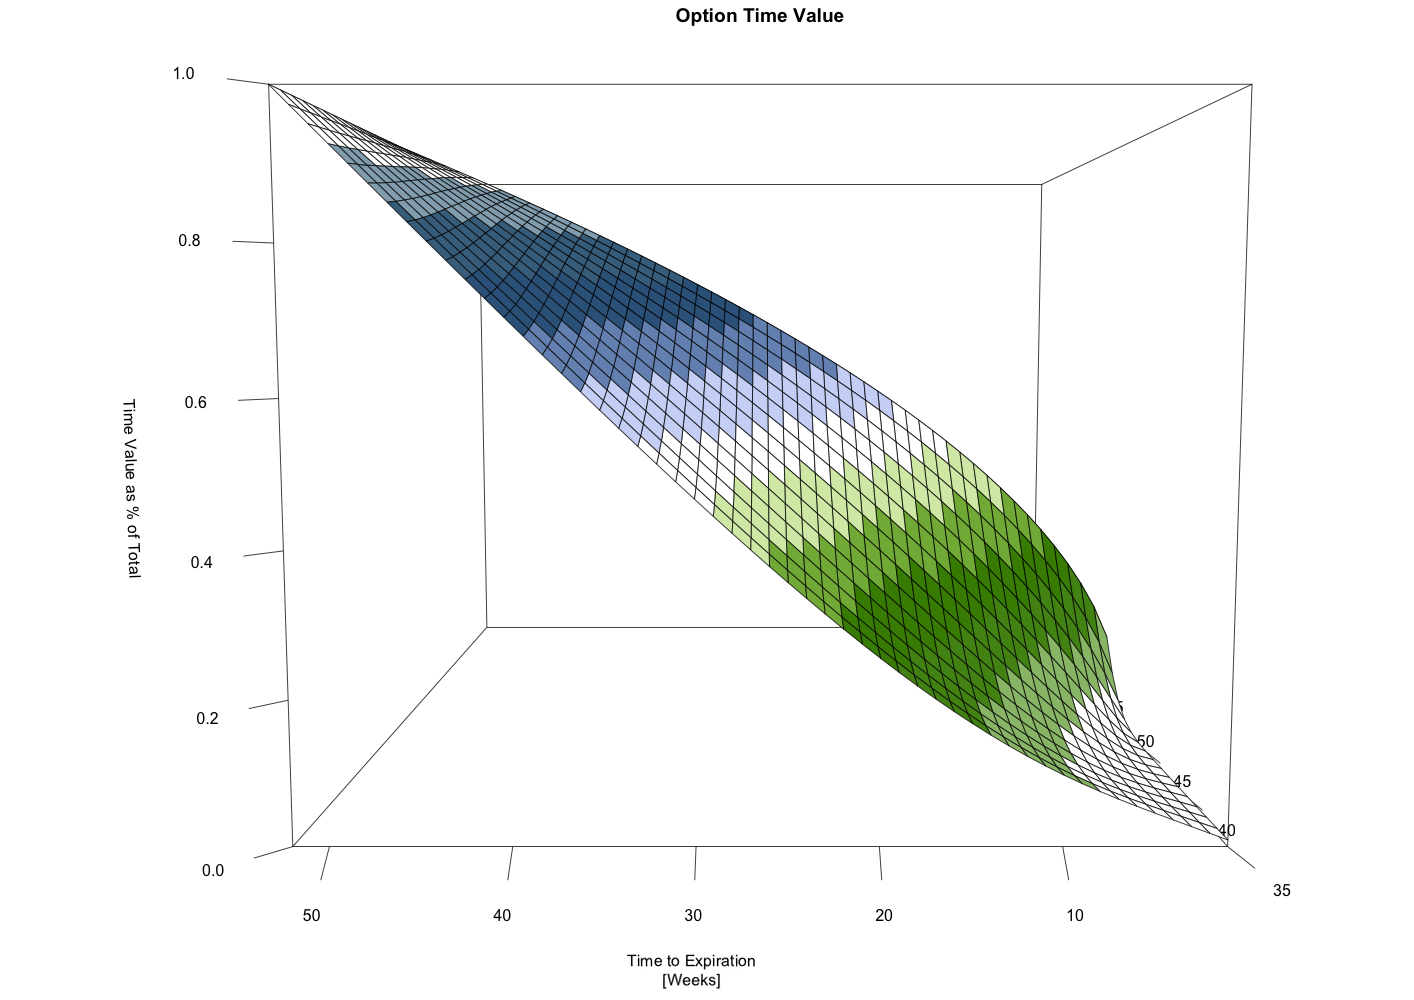
Interpreting the theta surface as the value of an option with a particular strike price over time, it’s possible to analyze the time value as a percentage of its original time value. In other words, the option’s time value over the course of its life as a percentage of the time value it started with at 52 weeks to expiration. With this information it’s easy to calculate the length of time it takes for a certain percentage of the options total time value to decay.

Time Value as a Percentage of Total Time Value

Switching to a profile view of the same surface with colored bands added helps to illustrate the differing rates of decay for the at-the-money options versus the away-from-the-money options. The white band through the center of the surface represents the 50% mark.

Time Value as a Percentage of Total Time Value

There are many potential ways to trade the complexities of the theta surface. Some strategies favor selling long-term strangles to benefit from the more rapid decay in percentage terms of the away-from-the-money options. Other strategies favor selling short-term at-the-money straddles to profit from the rapid decay of short-term at-the-money options. Both strategies can work given the right trading environment, but either way, they’re only designed to capture select portions of total time value.

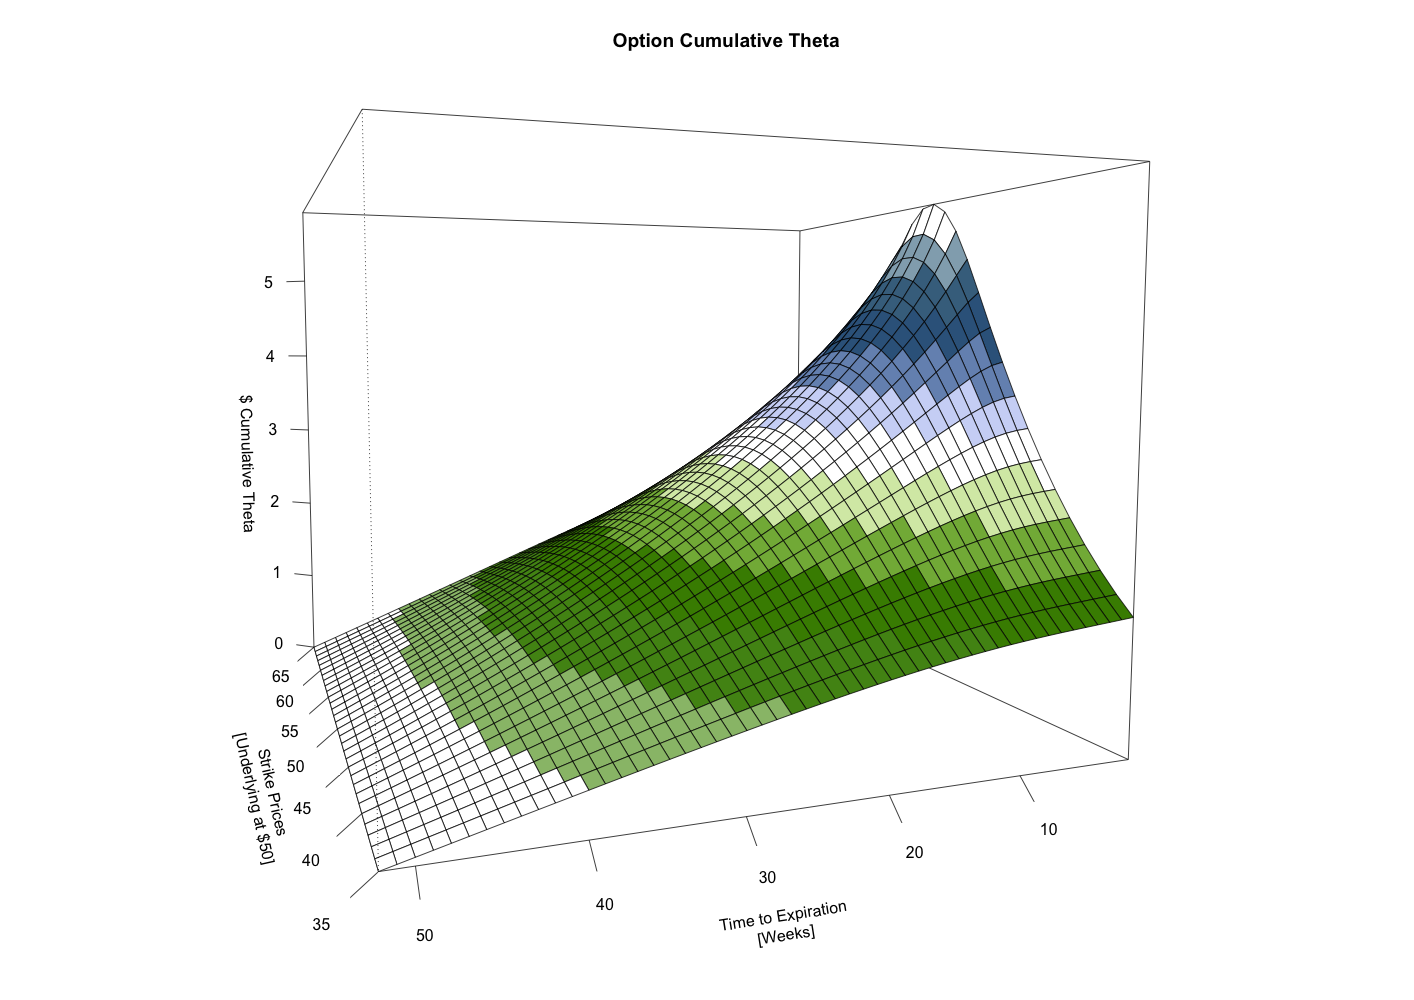
This last chart illustrates cumulative theta in real dollar terms. It shows that while long-term away-from-the money options may decay more rapidly as a percentage of time value, in dollars terms, their comparative lack of time value hampers the accumulation of theta. In other words, it takes significantly longer (sometimes twice as long) to make the same dollar amount of theta trading away-from-the-money options compared to the at-the-money options.

Cumulative Theta

These 3-dimensional surfaces can be tremendously helpful when trying to visualize and better understand option sensitivities. Hopefully, they helped illustrate the decay of an option’s time value, leading to better results the next time you’re constructing a theta capture strategy.
Volatility, Price and Delta: The Effects of Implied Volatility and Underlying Price on Delta

For options traders trying to understand how the value of an option might change given a change to one of the pricing model components, the obvious source for answers are the option sensitivities, otherwise known as the “Greeks”. What’s not as well know is that there are second-order sensitivities that can help explain how these first-order sensitivities change given a change to one of the pricing components. “Vanna” is a second-order sensitivity which describes the change in delta given a change in volatility.

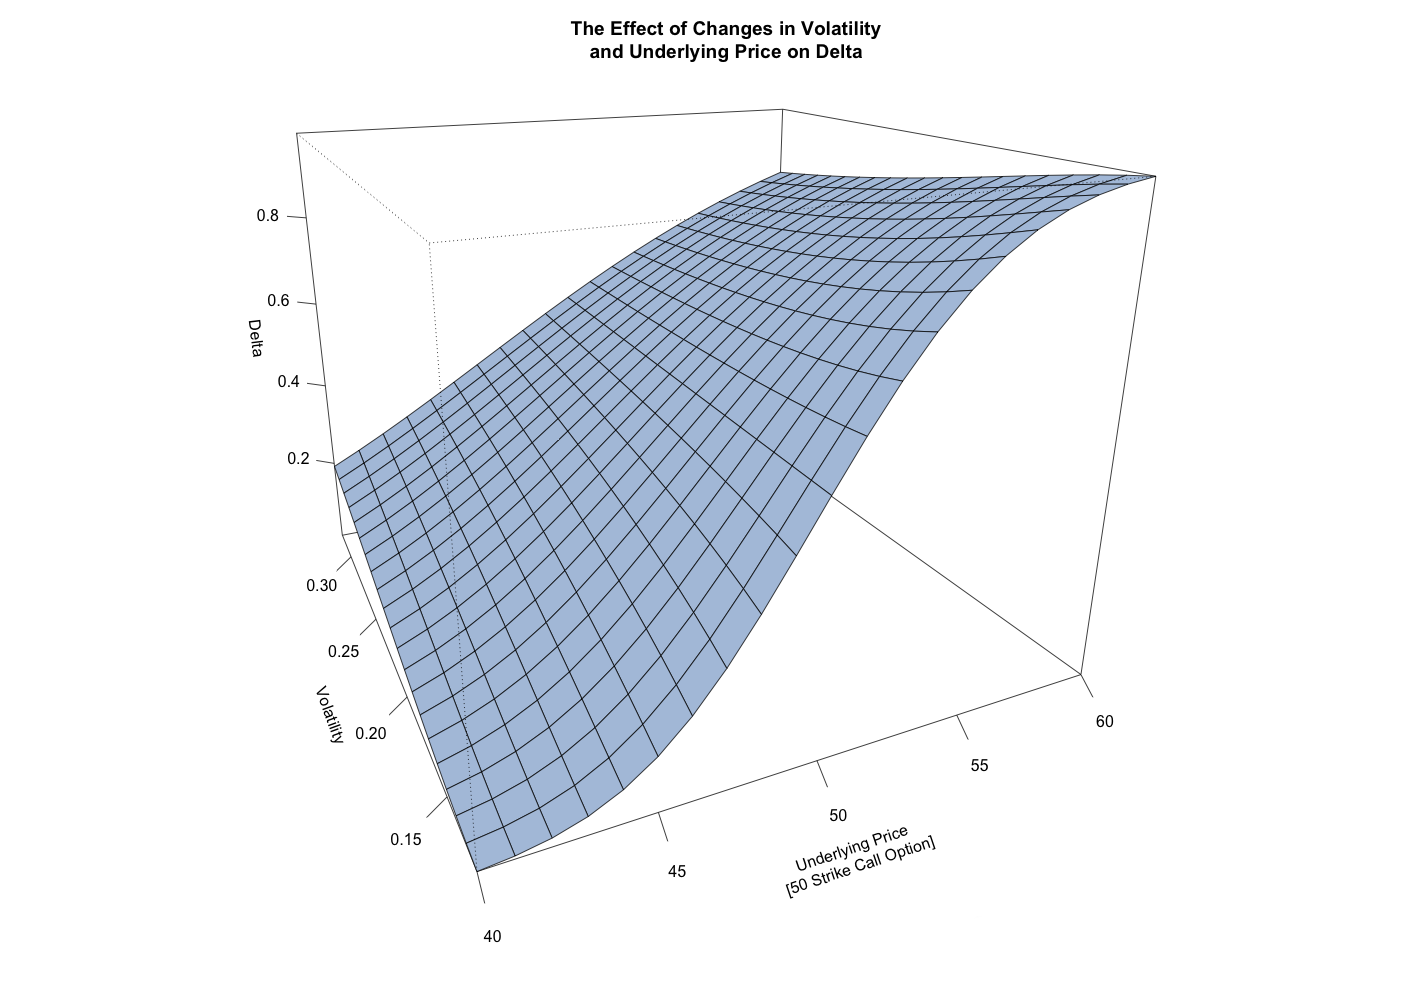
For a recent mentoring session, we were discussing the management and hedging of a complex option position, and the question came up of which volatility to use when calculating the delta for the position’s out-of-the money calls. What was initially unclear to the client was how changes in volatility might affect the delta of these out-of-the-money calls. As they say, a picture is worth a thousand words, so we put together this 3-dimensional chart, illustrating the effects of volatility and underlying price on the option’s delta.

Implied Volatilities Effect on Option Delta

What you’ll notice from this chart is that at higher volatilities, the range of delta across prices is much narrower and the change fairly linear. Whereas when volatility decreases, the range of delta is much wider and the change exhibits the “S” curvature that’s typical of delta, and reminiscent of the cumulative distribution function.

For our mentoring session we were concerned about the possibility of “over-hedging” these out-of-the-money calls. It was decided to use a somewhat lower volatility when calculating delta, thereby lower the delta and decreasing the hedge.

Gamma Scalping Cypress Semiconductor: An Example of Trading a Delta Neutral, Long Gamma Options Position

In one of today’s option mentoring sessions, one of the topics covered was the process of gamma scalping a delta neutral, long gamma options position. The client was having some difficulty thoroughly understanding the concept. To better explore the topic, we decided to simulate a very simple long gamma options position in Cypress Semiconductor (CY), and then to gamma scalp the underlying security, keeping the net position delta neutral.

Since this is purely for educational purposes, we’re not as concerned with the profitability of the strategy as we are with exploring the mechanics of gamma scalping. We will base the paper trading on real, live market prices in CY, and won’t go back and adjust trades to make the strategy look better or worse. If this isn’t already abundantly clear, please note that this is entirely for educational purposes and completely fictional. No actual trading will occur in the options or equity markets. Nor will we concern ourselves with many important details such as commissions, availability of stock lending, market liquidity, etc..

Option Position

The one and only options position will be a long position of 100 CY Mar 14 calls, purchased at a price of $1.00. The total cost is $10,000. We will hold this option position until expiration in March.

+100 CY Mar 14 calls @ $1.00

Initial Hedge

Each option has a delta of .53, so the net delta will be immediately hedged by selling 5300 shares of CY at $14.00 resulting in a delta neutral position. Over the life of the option, the option’s delta will change as the underlying security moves and as time passes (charm). We will try to gamma scalp the underlying as vigorously as possible, to offset the time decay (theta) each day.

Option Sensitivities (Greeks)

Option sensitivities for call options, from various months, with a strike price of 14, as of January 20th, 2015

ExpirationPriceDeltaGammaThetaVegaImp. Vol.
Feb 20, 20150.70 - 0.850.520.19-0.010.020.51
Mar 20, 20150.90 - 1.000.530.16-0.010.020.47
Jun 19, 20151.35 - 1.500.530.11-0.000.030.40
Jul 17, 20151.40 - 1.600.530.11-0.000.040.39

Earnings

Making this example just a bit more interesting, it turns out that Cypress Semiconductor has earnings in two days (Jan. 22th). It’s unclear how this will affect our gamma scalping and ultimately the profitability of this strategy. Hopefully it will be interesting and provide an additional learning opportunity.

As is fairly typical of a stock heading into earnings, the implied volatility of the options is elevated. Where the 20 and 50-day historical volatilities are .37 and .43 respectively, the option implied volatilities for the front two months are at least ten points higher. After earnings are released we would expect implied volatility to decrease so that it’s more in line with historical volatility. Therefore, we might see implied volatility drop .10 to .12 points and the value of the option position may decrease $0.20 to $0.24 given a vega of 0.02. In other words, the option position may take a quick hit. Hopefully, the underlying will provide ample opportunity to scalp stock to offset this loss. We will see. Normally it wouldn’t be advisable to enter into this kind of a long vega/gamma trade right before earnings, after the implied volatility is already so elevated, but sometimes you learn more when things go wrong than when they go right.

Gamma Scalping

Trades in the underlying will be recorded here on a somewhat regular basis. At the end, we will go ahead and tally up the results to determine the net profitability of the strategy. Hopefully though, most of the learning will be done along the way.

Paper Trades in Cypress Semiconductor (CY)
DateBuy / SellQuantityPriceHedge Position
Jan 20, 2015 2:34 CSTSell530014.00-5300
Jan 21, 2015 8:34 CSTBuy10013.82-5200
Jan 21, 2015 11:07 CSTSell20014.22-5400
Jan 22, 2015 8:33 CSTBuy20013.82-5200
Jan 22, 2015 8:39 CSTBuy30013.60-4900
Jan 22, 2015 8:41 CSTBuy30013.40-4600
Jan 22, 2015 9:14 CSTSell50014.20-5100
Jan 22, 2015 9:50 CSTSell30014.40-5400
Jan 22, 2015 10:41 CSTSell30014.65-5700
Jan 23, 2015 8:38 CSTSell50015.05-6200
Jan 23, 2015 8:51 CSTSell50015.15-6700
Jan 23, 2015 2:19 CSTSell50015.25-7200
Jan 26, 2015 9:05 CSTSell50015.35-7700
Jan 27, 2015 9:47 CSTBuy50014.80-7200
Jan 27, 2015 1:32 CSTSell50015.25-7700
Jan 29, 2015 9:24 CSTBuy50014.75-7200
Jan 30, 2015 8:34 CSTSell80015.25-8000
Jan 30, 2015 2:20 CSTBuy50014.75-7500
Feb 2, 2015 8:45 CSTBuy50014.40-7000
Feb 2, 2015 9:04 CSTBuy100014.10-6000
Feb 2, 2015 9:33 CSTBuy50014.10-5500
Feb 4, 2015 8:33 CSTSell50014.60-6000
Feb 5, 2015 2:56 CSTBuy50014.25-5500
Feb 6, 2015 10:28 CSTSell50014.70-6000
Feb 6, 2015 1:38 CSTSell50014.75-6500
Feb 9, 2015 8:47 CSTBuy50014.40-6000
Feb 10, 2015 8:48 CSTBuy50014.35-5500
Feb 10, 2015 1:40 CSTSell50014.70-6000
Feb 11, 2015 9:16 CSTSell50014.80-6500
Feb 11, 2015 9:59 CSTSell50014.90-7000
Feb 13, 2015 8:35 CSTBuy50014.50-6500
Feb 13, 2015 8:36 CSTBuy50014.40-6000
Feb 13, 2015 12:13 CSTSell50014.80-6500
Feb 18, 2015 11:18 CSTSell50014.90-7000
Feb 20, 2015 12:40 CSTSell100015.00-8000
Feb 24, 2015 8:40 CSTBuy150014.40-6500
Feb 24, 2015 9:38 CSTSell50014.75-7000
Feb 24, 2015 1:04 CSTSell50014.90-7500
Mar 2, 2015 9:56 CSTSell100015.22-8500
Mar 2, 2015 2:50 CSTSell50015.35-9000
Mar 2, 2015 5:58 CST (afterhours)Sell50015.55-9500
Mar 5, 2015 12:45 CSTSell50015.55-10000

Updates

  • After earnings were released on Thursday morning (Jan. 22nd), the initial price movement was fairly muted, down $0.06. From there the price continued to drop, bottoming at $13.39. Three of our paper trades were “executed” on the way down. The stock then rallied almost 10% from the low, closing at $14.82. Again, three paper trades were executed as the stock rallied. Culminating in some fairly nice two-way trading. Volatility came down slightly, but not as much as expected, probably due to the nice movement in the stock.

  • The February expiration cycle was 5 weeks long, leaving 4 more weeks until the expiration of the March calls. As of February 20th, CY closed at $14.95, and the CY March 14 calls closed at $1.24. Putting together a preliminary tally, thus far the strategy has made a net profit of $1263.00. That number represents a $2400 profit on the options position, a $4459 profit on CY purchases, and a $5596 loss on CY sales. Please note two things, the risk would have been far greater, but simply purchasing the call options outright without hedging would have been almost twice as profitable if you liquidated the position right now. And while there is currently only $0.29 of time value in each option, that essentially represents all of the profit in the options position. If there aren’t further scalping opportunities over the next 4 weeks, and if all of the time value is lost, the position will end up with a net loss of approximately $1650. At a rate of $0.005 per share, stock commissions thus far would have been $109.

  • On March 2nd, CY was trading up over 1% to $15.59 in after hours trading. Given the options position, and the fact that the 52-week high was $15.48, I was very tempted to sell 1000 shares for the paper account. With that stock sale, the options would be fully hedged, effectively turning all of the long calls into synthetic long puts. If the stock were to continue upwards there would be no further opportunities to trade or make money, but if the stock were to fall back towards $14, it would be a great trading opportunity. However, I had some mixed feelings about trading after hours. It felt a bit like cheating. Possibly due to the fact that I know that most “average” investors don’t trade outside of normal market hours. The reality though is that if you can get the trade executed, it counts. Whether that’s in pre-market trading, after hours, or during the day. In the end, I decided to split the difference and “sold” 500 shares for the paper account. In my opinion, that’s a fair compromise, in that I’m sure to regret it either way. If the stock continues up, it was too much, and if it goes back down, it wasn’t enough.

  • As of the trade on March 5th, the position has been fully hedged (i.e. all the calls have been turned into synthetic puts). Given that, it seemed an appropriate time to update the P&L thus far to see where the position stands. As of the last mark-to-market at Feb. expiration, the position was profitable but vulnerable to time decay. With the latest scalps and hedging, the position has effectively paid for all the option premium. That is to say, if the options position is marked to parity versus the stock position, the net P&L for the position would be a small, but positive, profit of $133. That’s an important milestone in that there was still $2900 of time value left in the options as of the last time the position was marked-to-market. With two weeks still left to expiration, a move back towards the 14 strike is certainly possible.

Vertical Spread Parity: (Or why there's nothing special about credit vertical spreads)

One of the first spreading strategies normally taught to beginning options investors is the vertical spread. This is a spread between two calls (or two puts) with the same expiration date, but differing strike prices. The strategy gets its name from the fact that the prices for each leg of the spread are typically listed vertically, one above the other, on a traders screen.

It’s a basic option strategy, but it has many desirable qualities, not the least of which is a clear and easy to define risk/reward profile. It tends to be a popular strategy amongst options newsletters. Unfortunately, many newsletters seem to suggest only trading vertical spreads in certain ways, or seem to imply that certain vertical spread strategies are superior to others. The fact is that there’s no secret sauce. There’s nothing special about selling (credit) vertical spreads that makes it more profitable than buying (debit) vertical spreads. In fact, it can be easily shown that they’re effectively the same strategy.

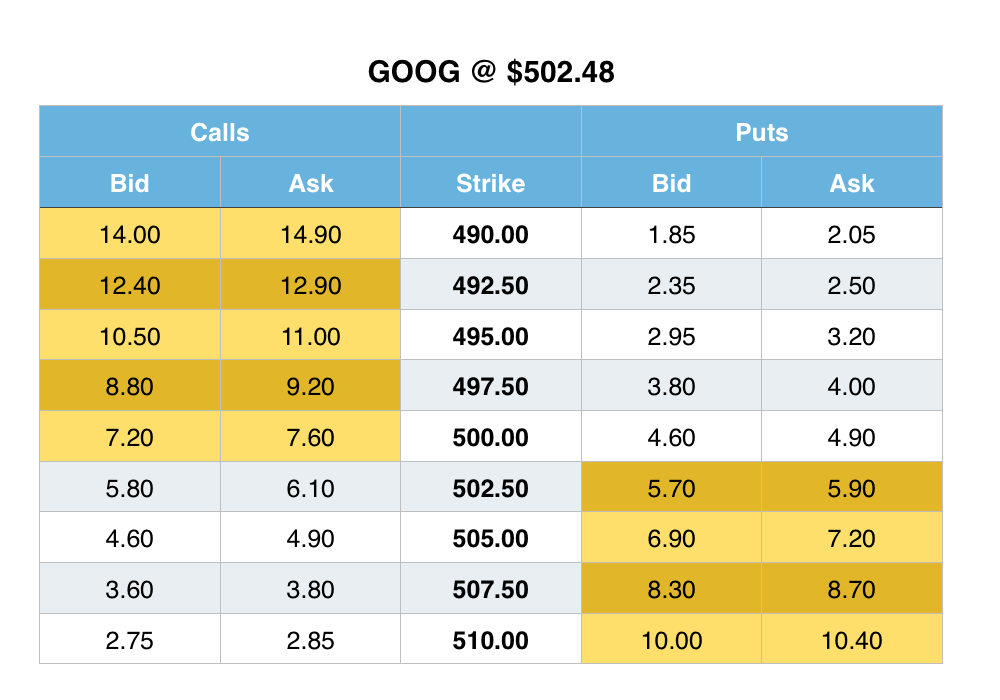
GOOG Option Prices

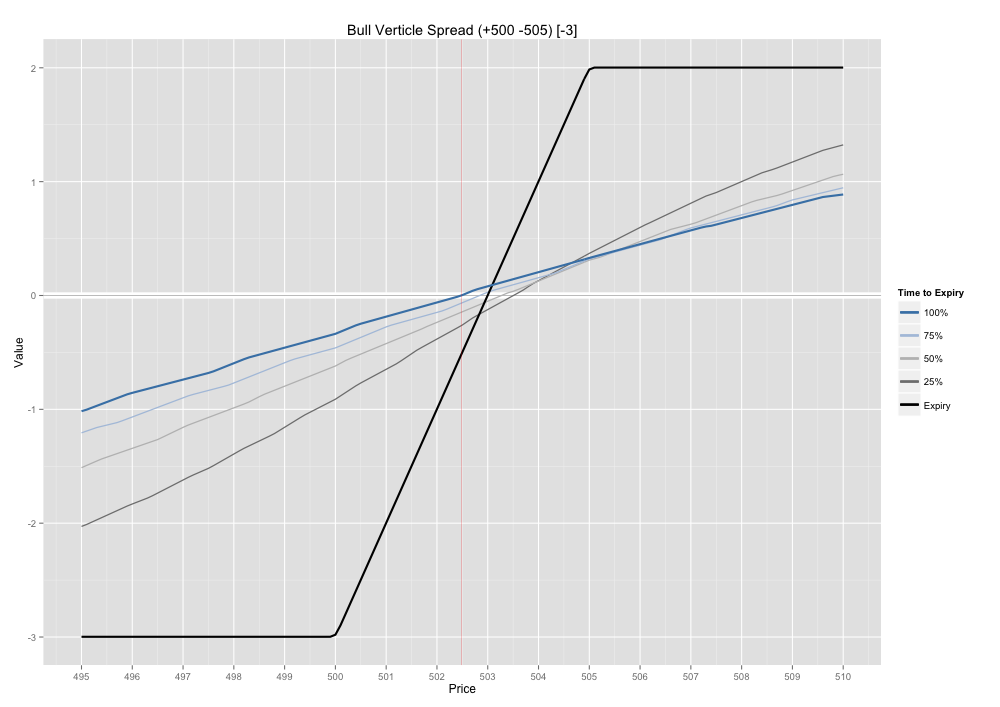
As an example, I will construct a simple “bull” vertical call spread in Google (GOOG), buying one of the 500 strike calls for $7.60, and selling one of the 505 strike calls for $4.60. An investor could purchase that spread for a net $3 debit. If the price of Google is less than $500 at expiration, the investor would lose the full $3 paid for the spread. If the price is greater than $505, the spread would be worth $5, the difference between the strike prices, and the investor would make a net of $2. Between $500 and $505, the value of the spread reflects the difference between the stock price and the $500 strike price. Therefore, a price of $503 at expiration would reflect the breakeven price for this investor’s particular trade.

Bull Vertical Option Spread

For anyone familiar with vertical spreads, all of this is fairly straight forward. But the important thing to understand is that this exact same spread can be constructed using put options instead of call options. The savvy investor knows this, and would check both the call and put markets to see which spread offers the most advantageous pricing.

To construct the same spread as a “bull” vertical put spread, the investor would buy one of the 500 strike puts for $4.90, and sell one of the 505 strike puts for $6.90. That spread would be sold by the investor for a net $2 credit. In the case of the put spread, the investor is short the spread for $2, but the risk profile is exactly the same as being long the call spread for $3. In both cases, the investor loses $3 if the underlying is below $500, makes a net of $2 above $505, and the payout varies one-for-one between $500 and $505. The reason the relationship between these two spreads exists is due to “synthetics”.

“Synthetic” is simply the terminology used by options traders to describe the relationship, or the process of turning calls into puts and vice versa. This is based upon the fundamental relationship between call and put options and the notion of Put-Call parity. A call option can be turned into a put option simply by executing a particular trade in the underlying security. So too, a put option can be turned into a call option with a trade in the underlying security. The basic recipes for standardized options are:

1 long  call + short 100 shares underlying = 1 long  put
1 short call + long  100 shares underlying = 1 short put
1 long  put  + long  100 shares underlying = 1 long  call
1 short put  + short 100 shares underlying = 1 short call

Going back to the first example, the long 500 call option could be constructed synthetically by buying one 500 put and buying 100 shares of GOOG. The short 505 call option could be constructed synthetically by selling one 505 put and selling 100 shares of GOOG. The two trades in the underlying security exactly offset each other, resulting in no net trade in the underlying. There then should be little surprise when you realize that the net options position for this “synthetic spread” ends up being identical to the put spread from the second example.

In terms of pricing, the relationship is such that for a “5-point” vertical spread, a $3 debit on one side is equivalent to a $2 credit on the other side. For a “10-point” vertical spread, a $6.40 debit would be equivalent to a $3.60 credit on the other side. Going back to the prices for Google, the 495 / 505 call spread could be purchased for $6.40. As has already been established, this is equivalent to selling the 495 / 505 put spread for $3.60. But interestingly, the 495 / 505 put spread actually appears to be $3.70 bid. In this instance, the savvy investor would rather sell the put spread for a $3.70 credit than buy the call spread for $6.40 debit, because it’s a better price, for the exact same position. Interest rates and dividends must typically be considered with synthetics and put-call parity, but for this particular example, they can largely be ignored.

These basic synthetic relationships are areas where professional traders, and especially high frequency traders, excel. Yet the average options investor pays little to no attention to synthetic relationships. Take the time to check these synthetic spread relationships and always get the best price for your trades.

Duel of the Deltas: Calculating Moneyness via Dual Delta

You would have to search long and hard to find an options trader who isn’t familiar with the concept of delta. As one of the most basic option sensitivities, or “Greeks”, delta expresses the relationship between the value of the option and the value of the underlying security. Secondarily, the delta is also sometimes used as an ad lib approximation of the percentage chance that an option will expire in the money. While this can be a quick and useful approximation, it’s not as accurate as many believe it to be. To correctly calculate the percentage chance that an option will expire in the money, one has to calculate what’s known as the “Dual Delta”.

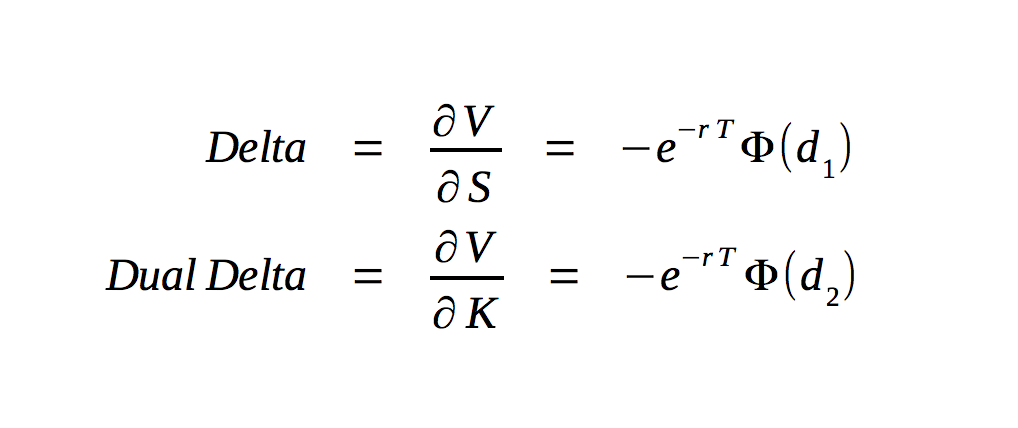
The calculations of delta and dual delta are very similar and fairly simple. The difference results from the fact that the dual delta is the derivative of the options value with respect to the strike price, rather than the derivative of the options value with respect to the price of the underlying asset. The formula for dual delta differs from the formula for delta only in the substitution of d2 for d1.

Dual Delta Formula

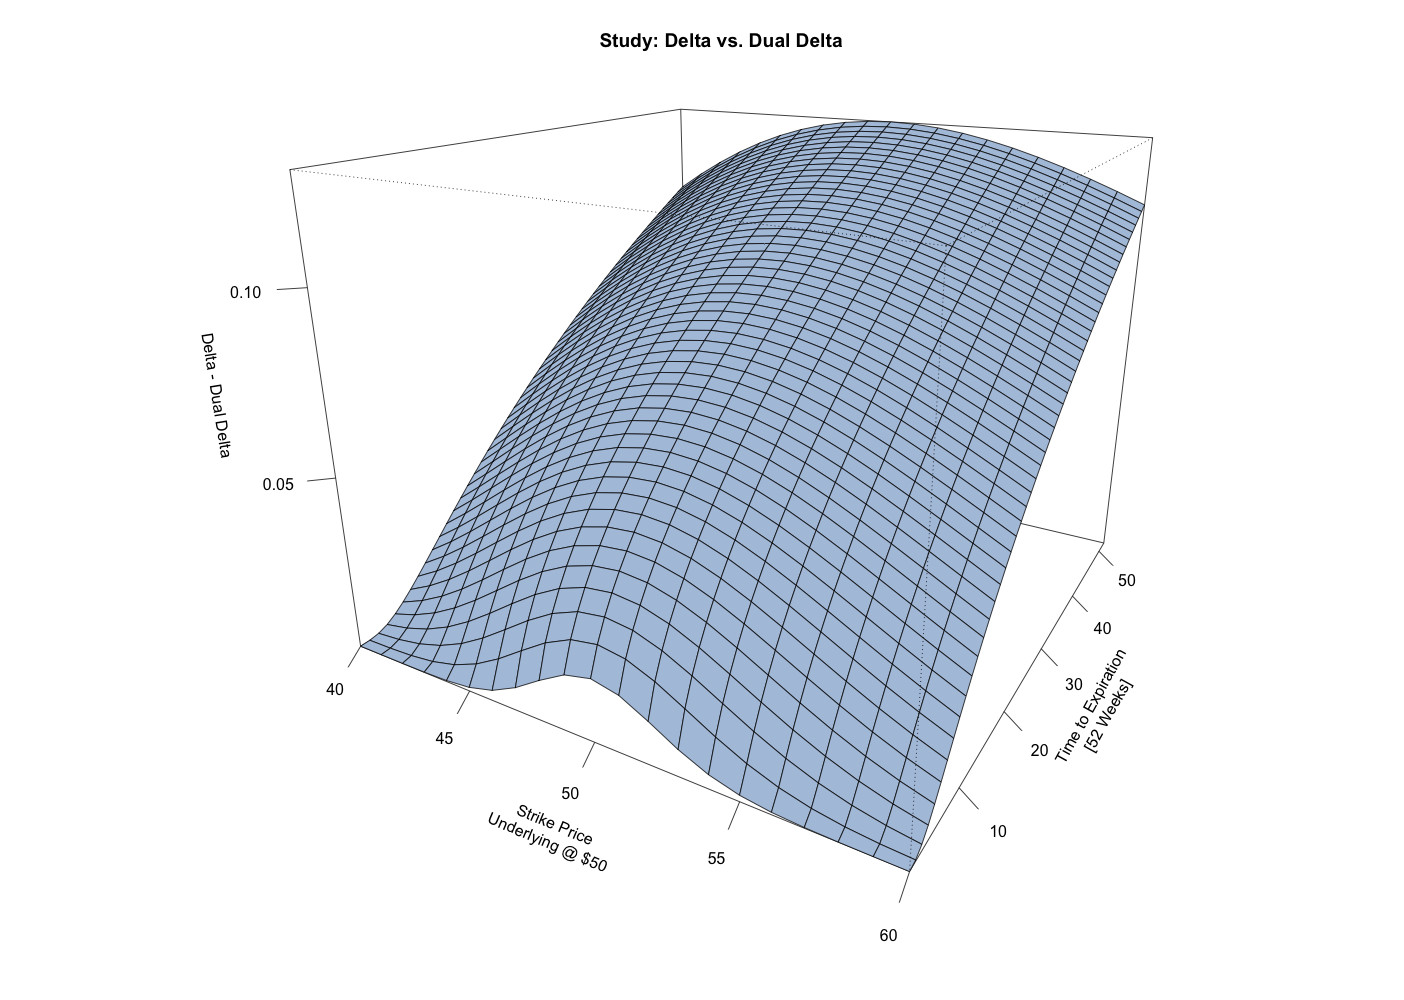
For options with a relatively short time remaining until expiration, the difference is only significant right at-the-money. However, for longer term options, especially for at-the-money options, the difference can be quite significant. For call options, dual delta is typically smaller in magnitude than delta, which implies that using call delta as a surrogate for dual delta overstates the probability of expiring in the money. For put options, it’s just the reverse. The dual delta is typically larger in magnitude than the delta, which implies that using put delta as a surrogate for dual delta understates the probability of expiring in the money.

Delta - Dual Delta 3D Plot

So when formulating an options strategy that depends upon an accurate assessment of the probability of an option expiring in the money, take the time to actually calculate the dual delta. The increase in accuracy can be substantial, and might make the difference in the success of your strategy.