Love Gamma? Where to find the highest gamma to theta ratio
If you’re an options traders that likes to get a lot of bang for your buck, here are two things to look for in an underlying security that can help maximize the ratio of gamma to theta in your options position.
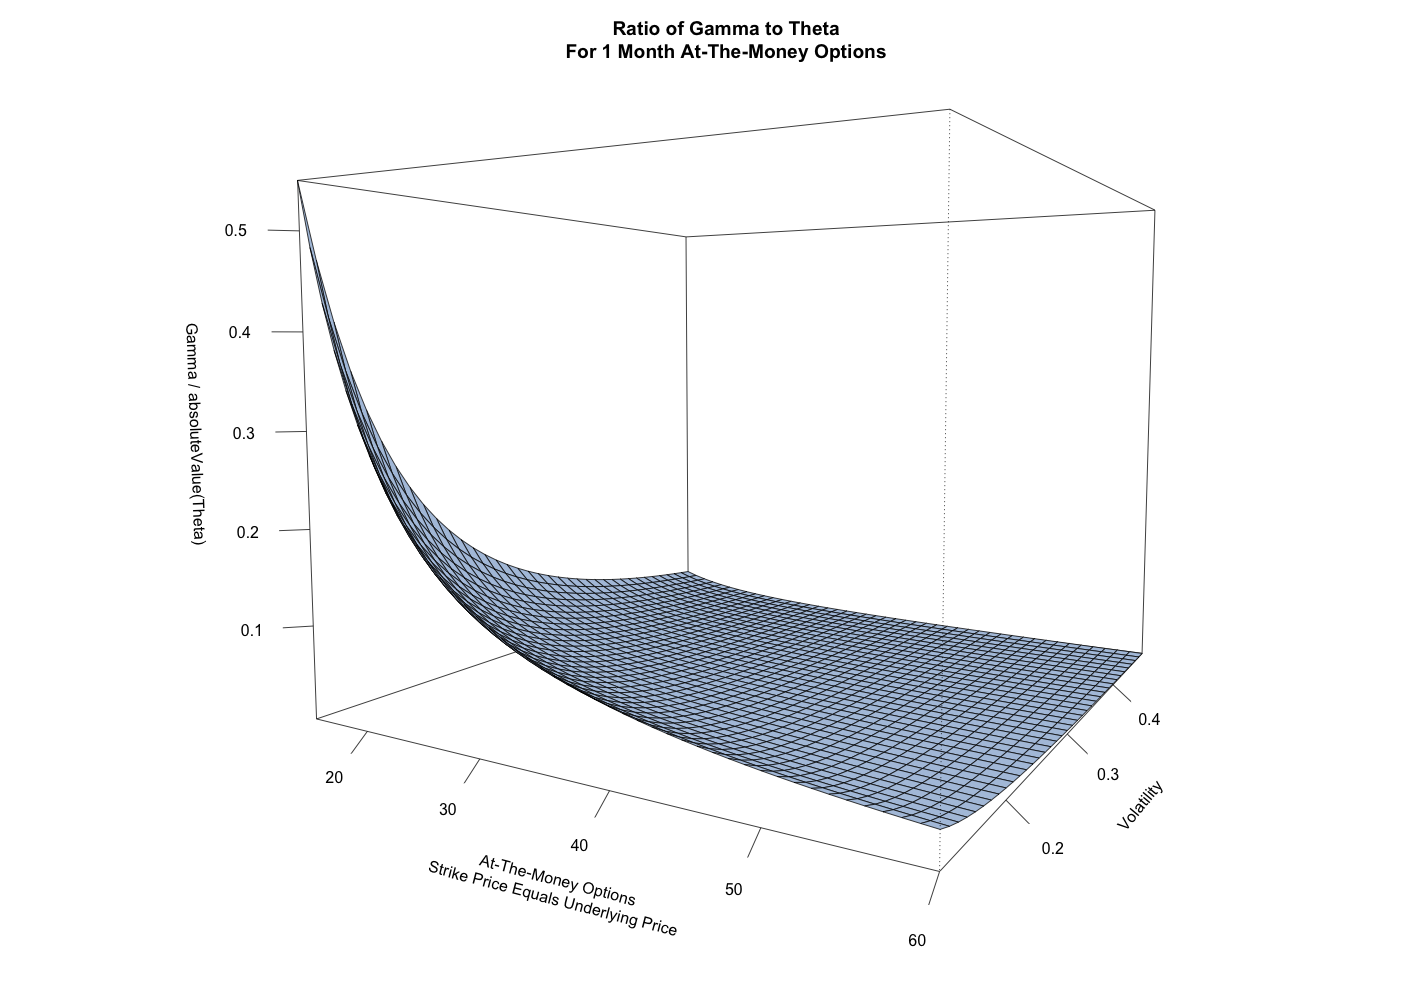
This 3-dimensional surface illustrates the way in which underlying price and volatility affect the ratio of gamma to theta for at-the-money (ATM) options. What you see is that for a call option with one month left to expiration, the at-the-money option for a lower priced underlying will have a higher gamma to theta ratio. You also see that lower volatility at-the-money options have a higher gamma to theta ratio. Combining these two characteristics, the lower the underlying price and the lower the volatility, the higher the gamma to theta ratio for the at-the-money option.
There are a couple of important details that should be clarified in this chart. Since theta is always negative, the absolute value of theta has been used for these calculations because this results in a ratio that is far more intuitive to interpret. Theta also is calculated here in cents, not dollars, therefore the magnitude of the ratio may initially appear smaller than some are used to seeing. Additionally, this surface only displays values for at-the-money options, so for the axis lying in the foreground of the chart, the ratio is for a 20 strike option with the underlying price at $20, a 40 strike option with the underlying price at $40, etc..
So if you’re a long gamma trader trying to maximize your gamma to theta ratio, look for low priced, low volatility underlying securities to load up on “cheap” gamma and then hope for that pop in volatility.
