Path Independence of Volatility
Volatility is undoubtably one of the most important aspects of option trading. Although the basic idea of calculating historical volatility as the annualized standard deviation of a series of lognormal close to close price returns is fairly simple, there exist a broad range of adaptations of this general idea in an attempt to glean additional insight and efficiency from market data. Nonetheless, this traditional method of calculating volatility is still in wide use due to the simplicity of its calculation and the intuitive nature of its insights.
While the calculation of historical volatility is often used as a rough estimator for future volatility, this information may give an options trader some idea of the likely size of moves in the underlying, but it doesn’t provide any information about the direction, path, or minimum range of price changes. The limitations of volatility become evident when comparing similar time series that follow very different paths.
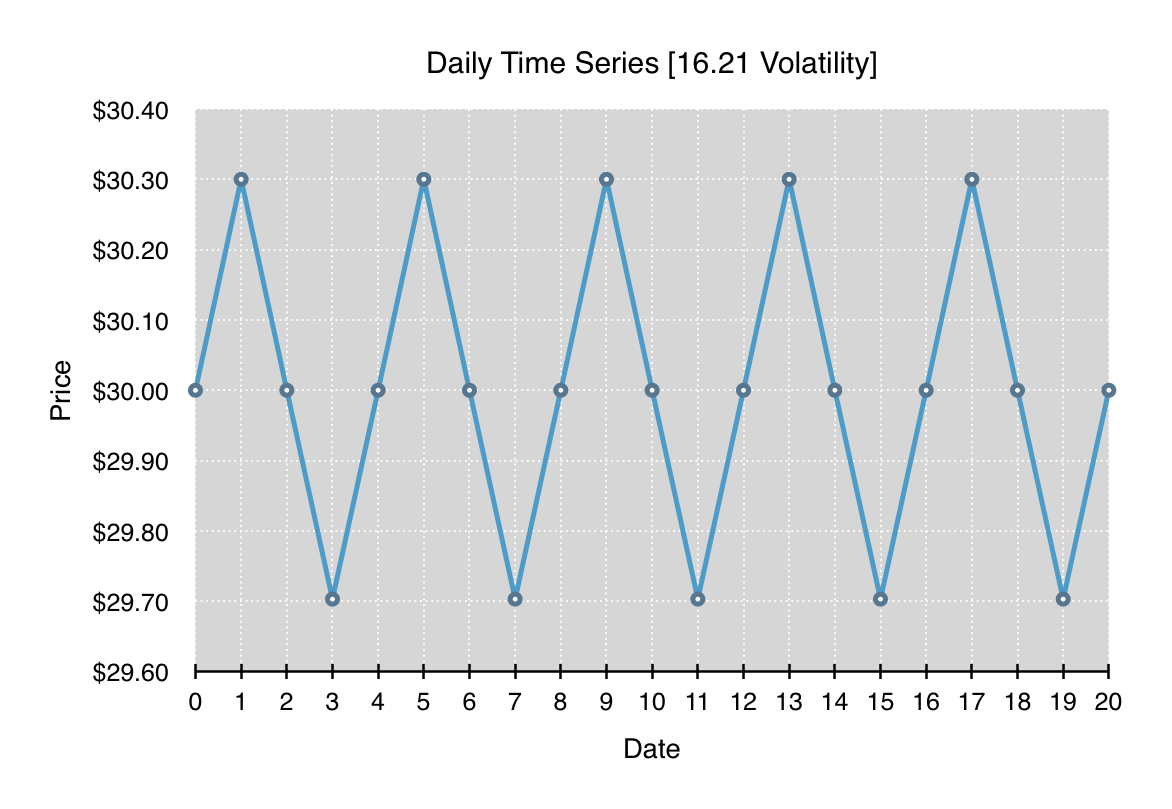
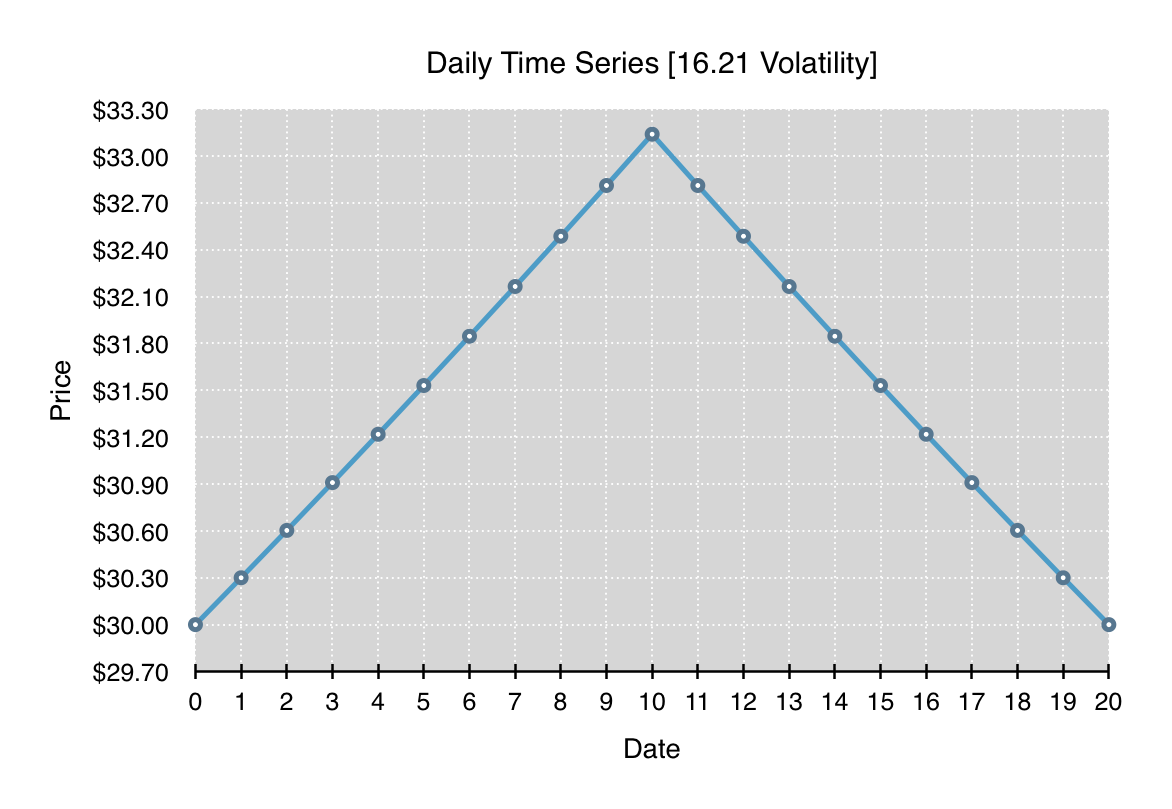
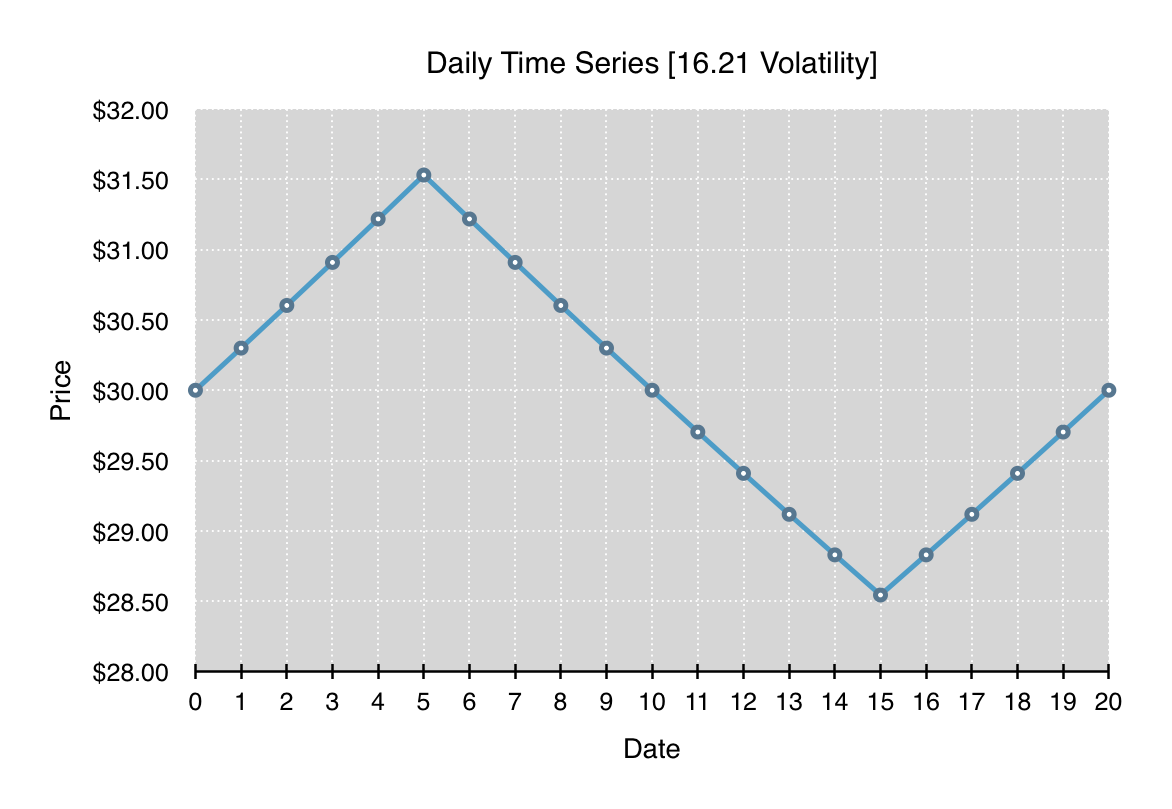
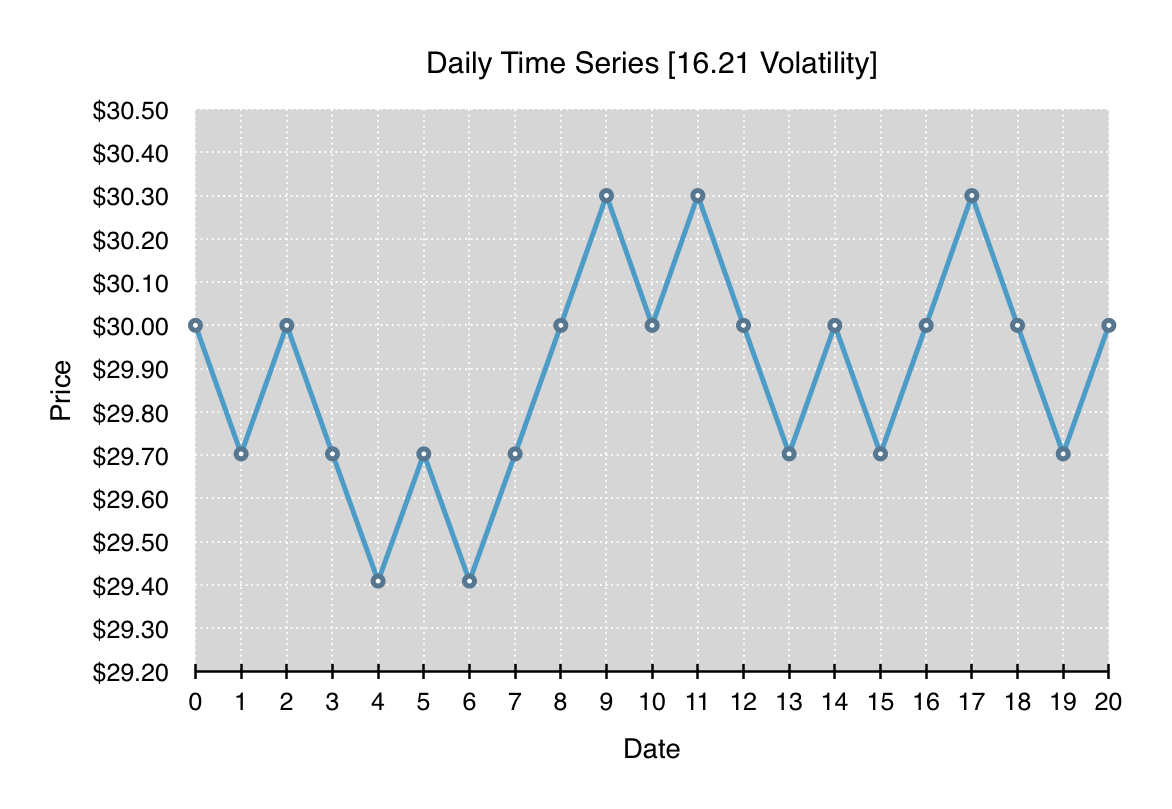
All four of the following charts depict a time series which begins and ends at the same price. Each time series has the same overall annualized volatility of 16.21, and at each time step, the percentage change, either up or down, is the same. What differs significantly between all the charts is the path and range of prices traversed throughout the time series.
What should be clearly evident from these four time series is that volatility is entirely path independent. Each of the time series can be reordered to form any path as long as the lognormal price changes that make up the time series stay the same. Given a particular volatility, it’s just as likely to have the time series oscillate in a tight band around one price as it is to have the time series break in one direction for an extended run and then return.
The implication for option traders is that, for many option trading strategies, one should not only account for expectations of future volatility, but one should also take into account expectations for path persistence or anti-persistence. As an example, a long gamma position such as a long straddle might forgo delta hedging when traded against an underlying security that tends towards highly persistent paths. Whereas the same position traded against an underlying security that’s more anti-persistent might be far more aggressive in delta hedging any significant moves.
So when formulating option trading strategies, while the forecasting of future volatility is tremendously important, the incorporation of additional metrics that can lend insight into the persistence of future price changes and/or the cumulative price range can be tremendously helpful in the success of the strategy.


