Sell Rosh Hashanah, Buy Yom Kippur?
With yesterday’s 1.6% sell off in the major indices, and the fact that it happened to coincide with the start of Rosh Hashanah, some traders were dredging up the “Sell Rosh Hashanah, Buy Yom Kippur” adage to try to the explain the market action. Like many of these old adages, it’s hard to know whether there’s any quantitive data that actually supports their use. Much of the time, even if these strategies did work at some time in the past, they rarely do today. But there’s no way to know without crunching the data, so that’s what we did.
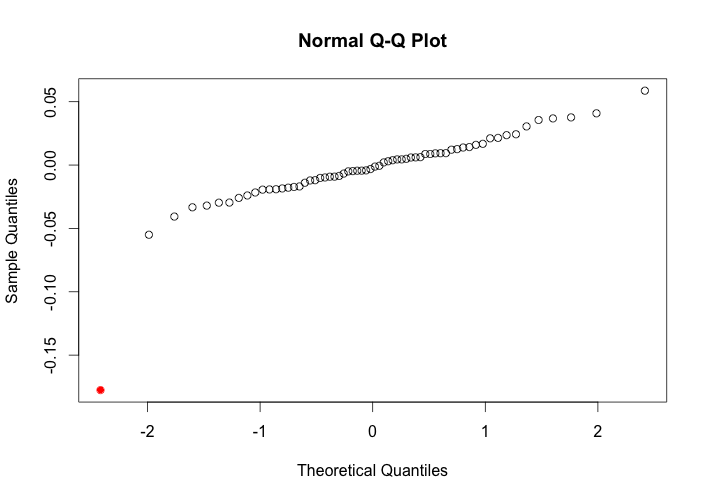
What was found by analyzing data from the S&P 500 index (SPX) from 1950 to 2013, was that there’s little evidence to justify the strategy of selling Rosh Hashanah and buying Yom Kippur. Over that 64 year period, the mean return for that 9 day period was basically zero. The market didn’t tend to go up or down. It was just a random walk. There was one noticeable outlier in the midst of all this well behaved data, and that was the year 2008. In that one exceptional year, the SPX was down an amazing 17.8% over those nine days. But it was a pretty exceptional year for other reasons as well.
| 1950 to 2013 | Excluding 2008 | |
|---|---|---|
| Maximum | 0.058686056 | 0.0586860556 |
| 3rd Quartile | 0.010087528 | 0.0107616799 |
| Mean | -0.003352942 | -0.0005871179 |
| Median | -0.002184052 | -0.0012134584 |
| 1st Quartile | -0.016973419 | -0.0154244534 |
| Minimum | -0.177599826 | -0.0550011089 |
| Std Deviation | 0.030481498 | 0.0211335060 |
| Skewness | -2.793708622 | 0.1961559384 |
| Ex. Kurtosis | 15.016974260 | 0.3007369142 |
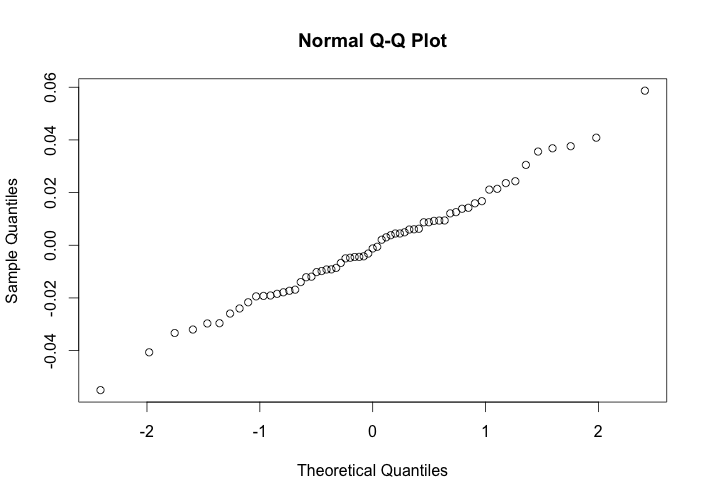
A Q-Q plot is a graphical method for comparing a given set of data to a normal distribution. In the plot on the left below, the majority of the data shows a strong correspondence to the normal distribution. The exception is the data point from 2008 which is highlighted in red in the lower left corner of the plot. In the plot on the right, the outlier from the year 2008 has been removed, better showing how nicely the data corresponds to a normal distribution.
The reason this is important, is that the one data point from 2008 significantly changes the mean, skewness, and kurtosis of the returns. That one datapoint might lead one to believe that the distribution of returns is highly negatively skewed with long tails. However, excluding that one year from the other 63 years, shows a significantly different situation. If fact, the overwhelming majority of data points show the mean, skewness, and kurtosis to be very close to zero, if not slightly positive.

