Theta: A Detailed Look at the Decay of Option Time Value
Of all the option sensitivities, or Greeks, there is likely none that is obsessed over by beginning options traders as much as theta. It seems that this obsession largely stems from a fear that they might be the sucker that gets stuck owning some rotting, soon-to-be worthless option contract. Given all this obsessing, one might expect a better understanding of theta. Unfortunately, many beginning and experienced option traders alike fall prey to generalities concerning the nature of theta. Hopefully this article will provide some insight into the specifics of time decay.
Standardized options exist for a finite period of time. As time passes, and the life of an option draws shorter, the potential for various profitable and unprofitable eventualities decreases for the underlying security. As an option is a financial contract with an asymmetric risk/reward profile, in practice this means that the potential for various profitable events decreases for the option. Therefore, as time passes, an option’s time value decreases. The change in an option’s value resulting from the passage of time, from one day to the next, is known as theta, and it is always negative.
While the trajectory of theta might be clear, the actual rate of change can leave some traders baffled. The most common general misconception is that an option’s theta always increases in magnitude over time. Thereby decaying at a faster and faster rate. While this is true for at-the-money options, it doesn’t hold for in-the-money or out-of-the-money options. After illustrating the complexities of theta, or time value decay, it should be clear what really happens.
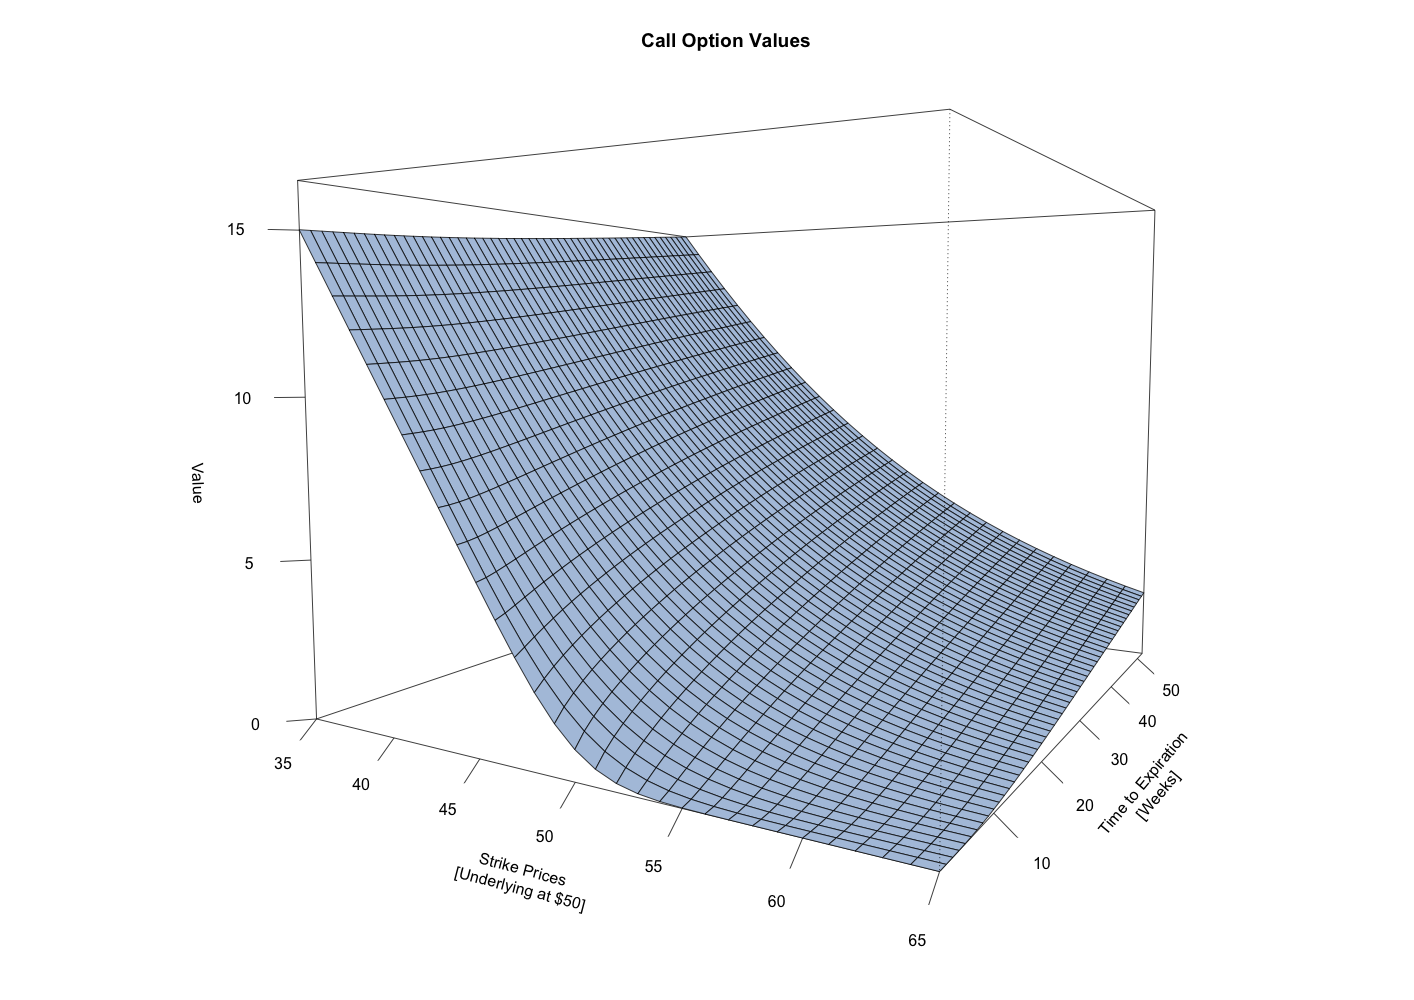
This first chart shows a 3-dimensional surface depicting the value of call options with varying strike prices and with varying times to expiration. For all of these call options, the underlying security is priced at $50. One general observation is that the in-the-money options, those with a strike price less than $50, have a greater value commensurate with the degree to which they’re in-the-money. The out-of-the-money options, those with a strike price greater than $50, have a lesser value, again commensurate with the degree to which they’re out-of-the-money. Another general observation is that for all the options, regardless of whether they are in, at, or out-of-the-money, their value decreases as the time to expiration decreases.
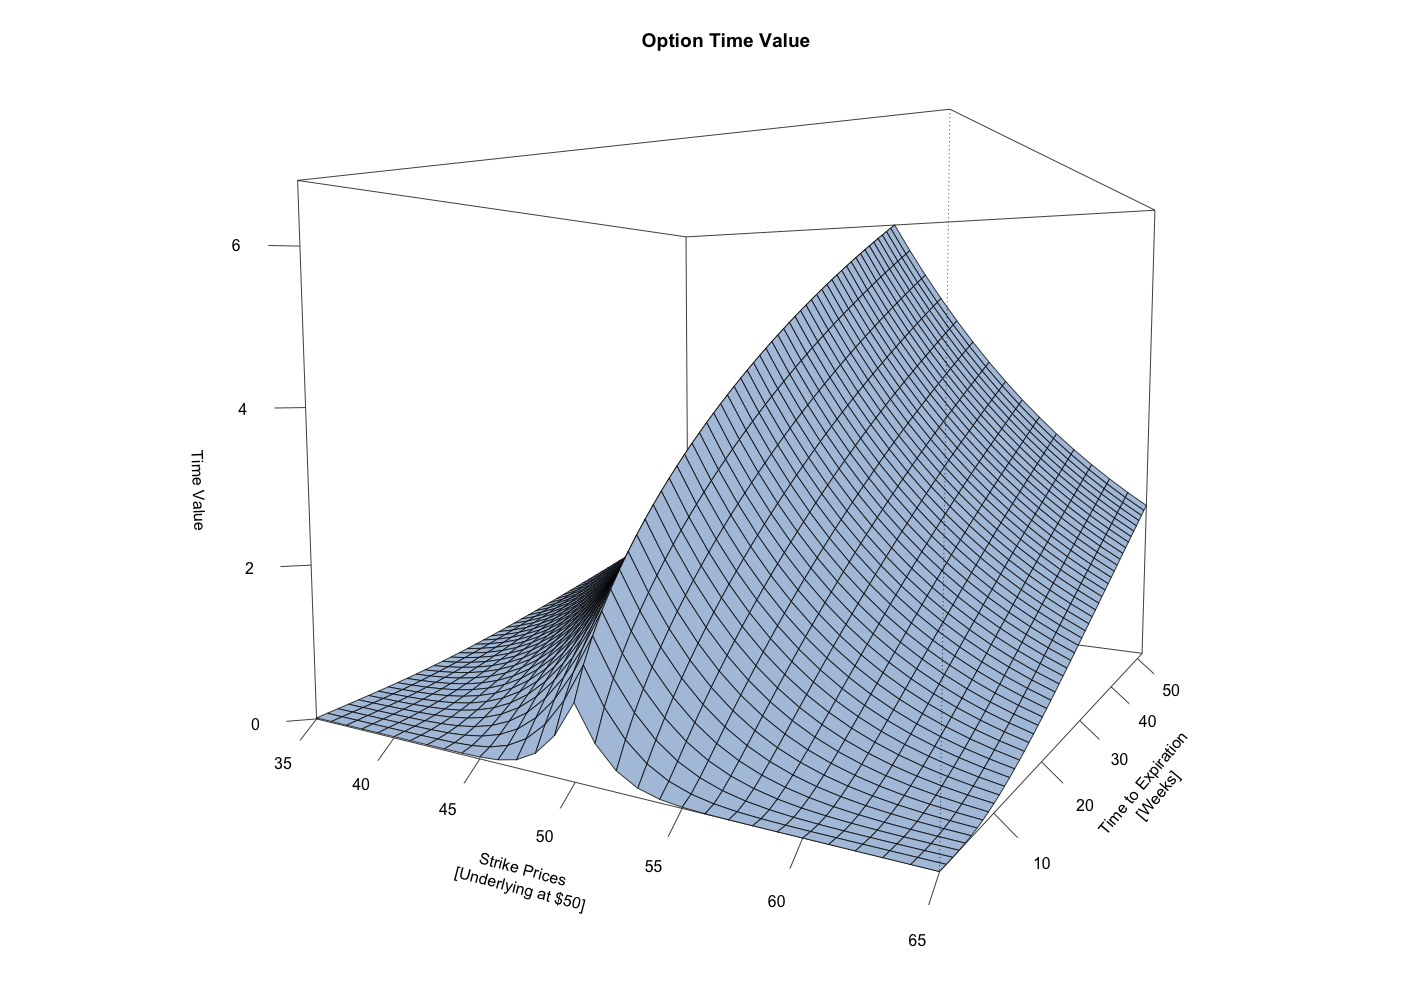
The reason the in-the-money options have higher values than the out-of-the-money options is that their values are composed of both time value and intrinsic value, whereas the value of the out-of-the-money options are composed of only time value. Intrinsic value describes the degree to which an option is in-the-money. This second chart shows the same 3-dimensional surface, but with the intrinsic value removed from the value of each call option. This shows that the time value is fairly symmetric on either side of the at-the-money options and that the at-the-money options have the most time value for a given time to expiration. It also shows the typical decline in time value as the time to expiration decreases.
What’s also readily apparent is the fact that for at-the-money options, time value decreases at an increasing rate as the time to expiration decreases. That is the “expected” behavior for theta. However, the change in time value for the in-the-money and out-of-the-money options show quite a different pattern of decay. The decrease in time value is characterized by a fairly linear rate of change with a decrease in the rate of decay over the last few weeks to expiration. So where the at-the-money options decay at an ever faster rate into expiration, the decay of the in-the-money and out-of-the-money options level out, as there is little time value left to decay.
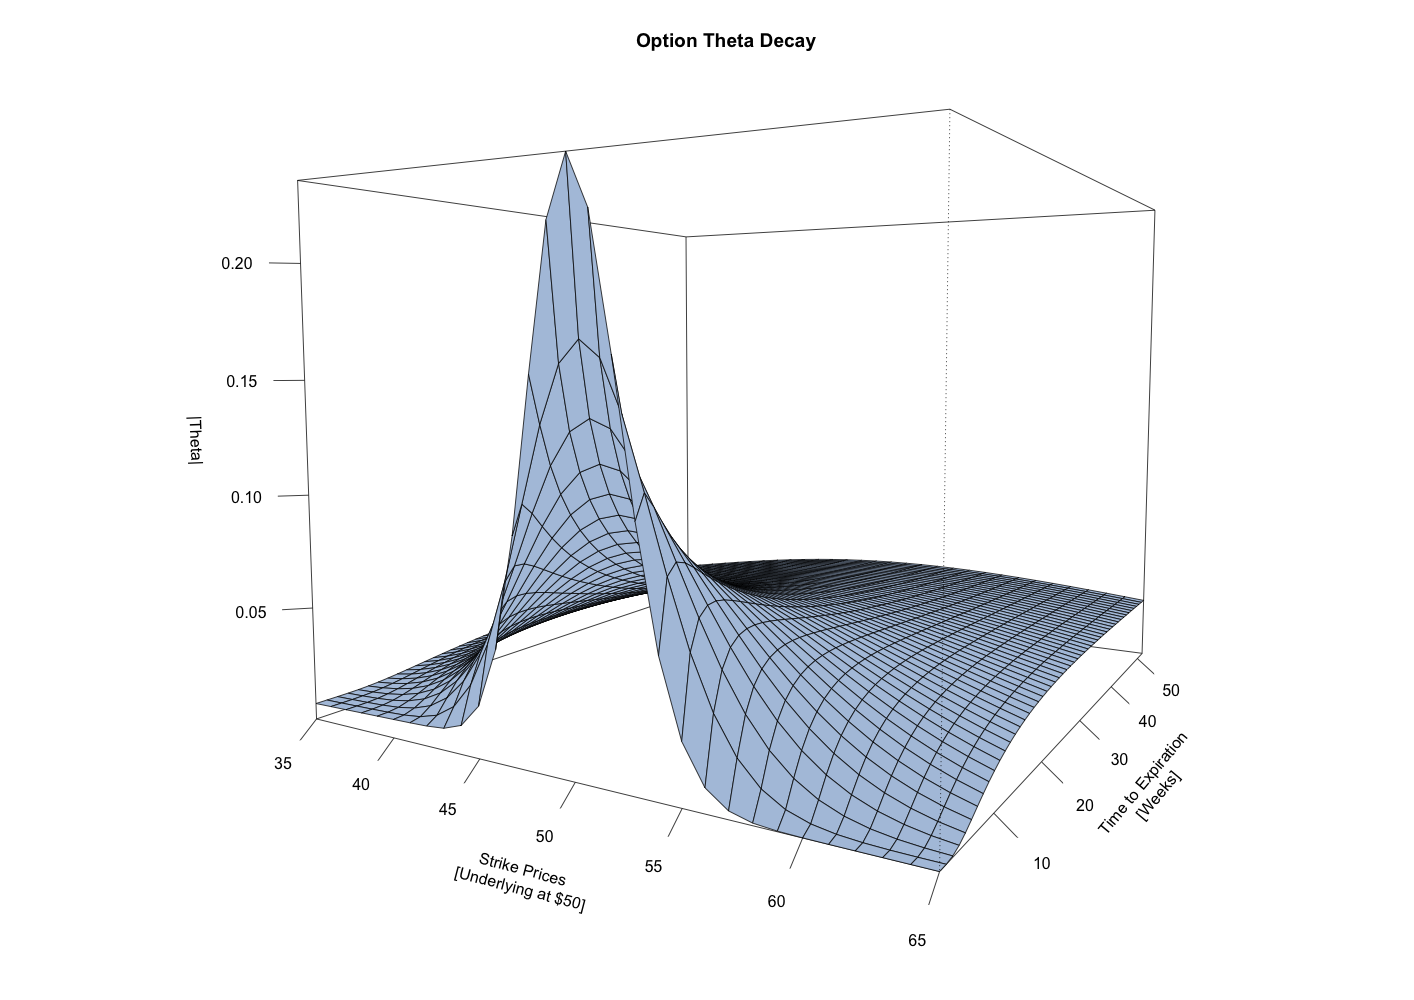
The difference in behavior can be seen even more clearly from this next chart. It shows a 3-dimensional surface displaying the absolute value of theta, or time value decay, for the corresponding call options. (Theta is always a negative value, but for the purpose of comparing magnitudes across the surface, using the absolute value of theta tends to be more intuitive.) Here, the at-the-money options exhibit a near exponential increase in theta as expiration nears. Whereas the in-the-money and out-of-the-money options exhibit a fairly constant rate of theta that gradually decreases over the last few weeks into expiration.
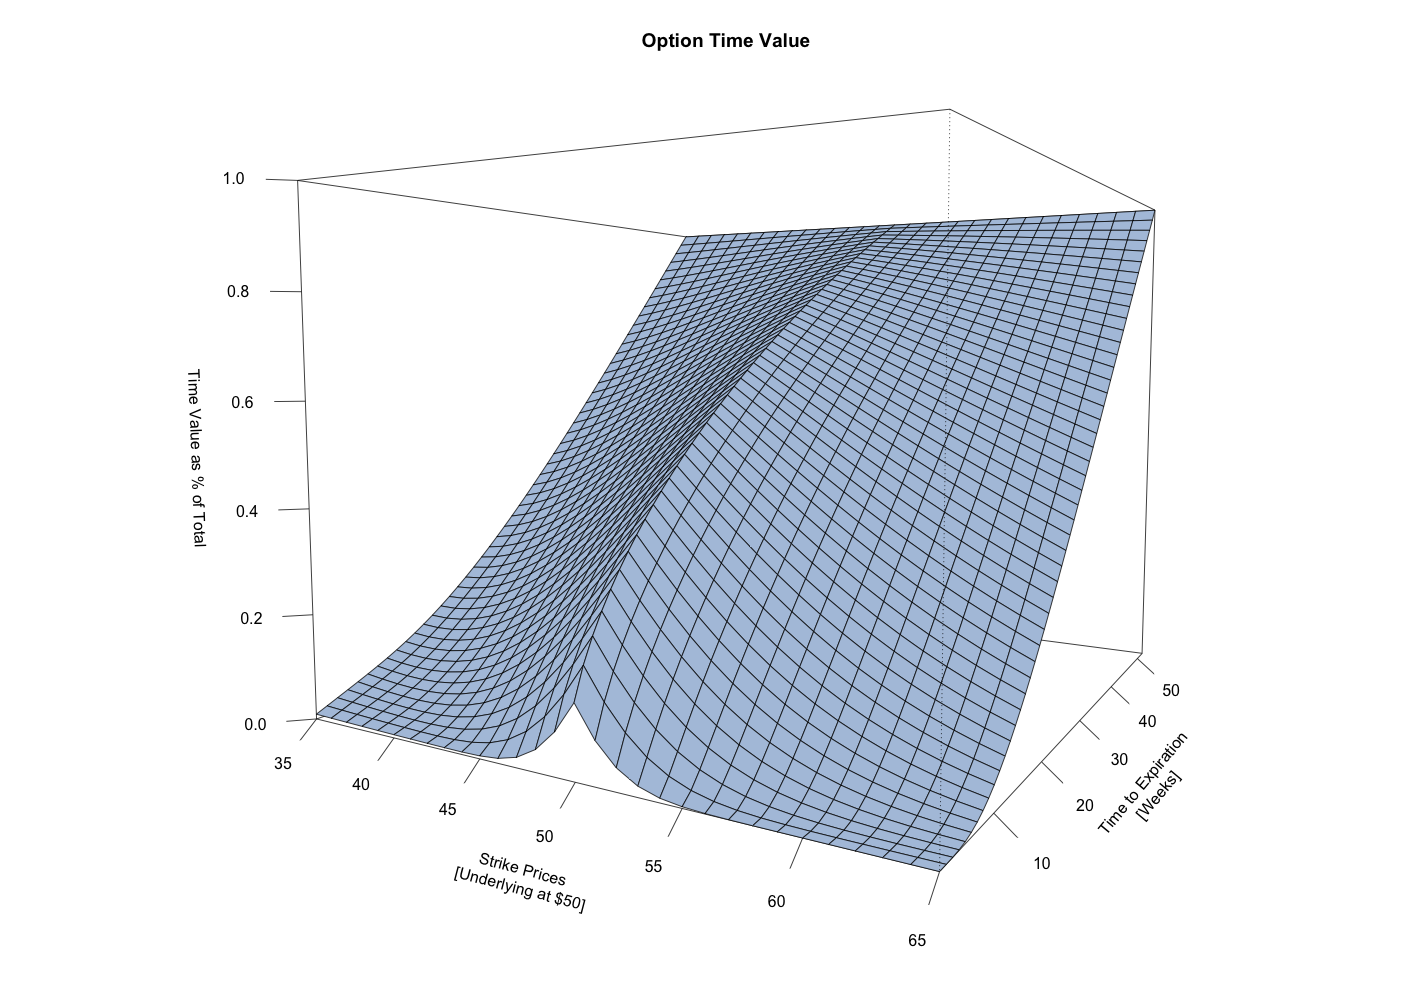
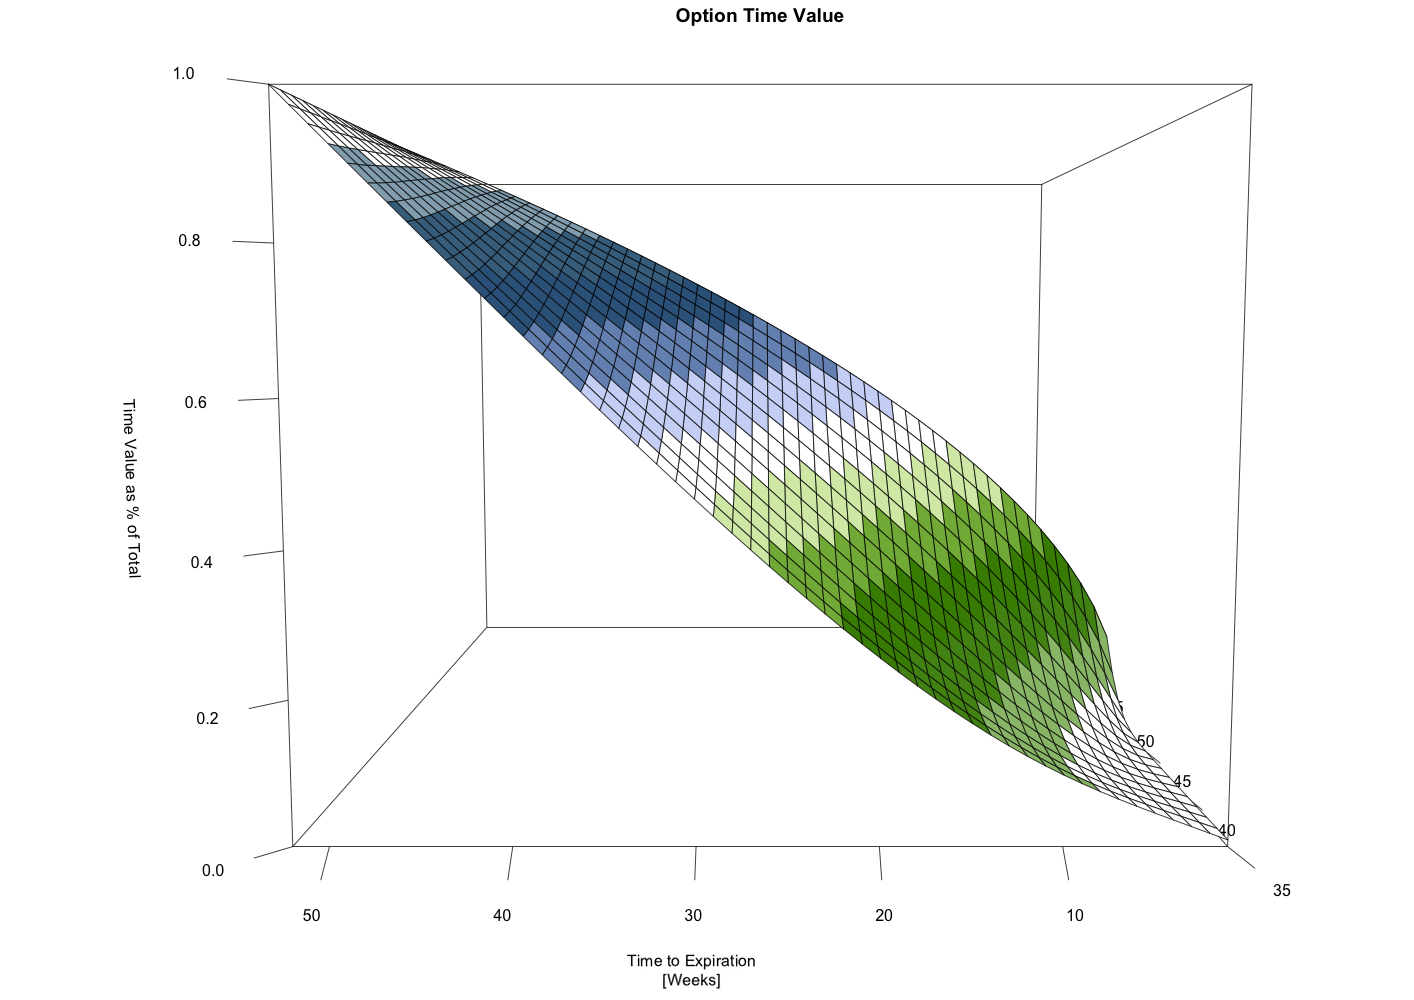
Interpreting the theta surface as the value of an option with a particular strike price over time, it’s possible to analyze the time value as a percentage of its original time value. In other words, the option’s time value over the course of its life as a percentage of the time value it started with at 52 weeks to expiration. With this information it’s easy to calculate the length of time it takes for a certain percentage of the options total time value to decay.
Switching to a profile view of the same surface with colored bands added helps to illustrate the differing rates of decay for the at-the-money options versus the away-from-the-money options. The white band through the center of the surface represents the 50% mark.
There are many potential ways to trade the complexities of the theta surface. Some strategies favor selling long-term strangles to benefit from the more rapid decay in percentage terms of the away-from-the-money options. Other strategies favor selling short-term at-the-money straddles to profit from the rapid decay of short-term at-the-money options. Both strategies can work given the right trading environment, but either way, they’re only designed to capture select portions of total time value.
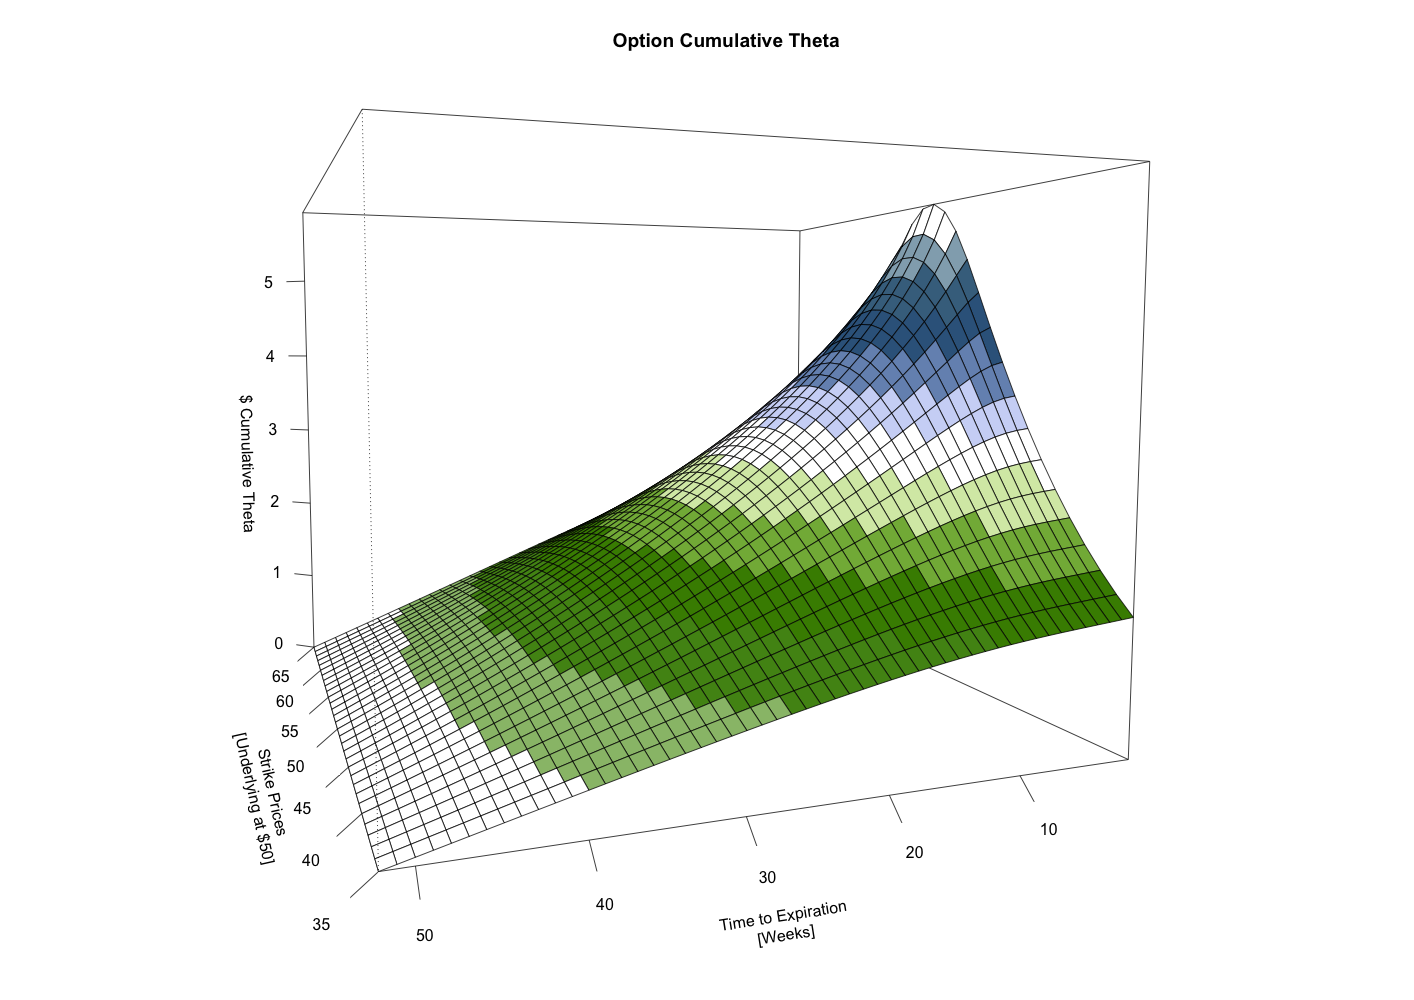
This last chart illustrates cumulative theta in real dollar terms. It shows that while long-term away-from-the money options may decay more rapidly as a percentage of time value, in dollars terms, their comparative lack of time value hampers the accumulation of theta. In other words, it takes significantly longer (sometimes twice as long) to make the same dollar amount of theta trading away-from-the-money options compared to the at-the-money options.
These 3-dimensional surfaces can be tremendously helpful when trying to visualize and better understand option sensitivities. Hopefully, they helped illustrate the decay of an option’s time value, leading to better results the next time you’re constructing a theta capture strategy.
