Volatility of VIX
The S&P 500 index (SPX) has been down five of the past six trading sessions and along with that has come a significant increase in the VIX implied volatility index. But the most interesting aspect of the selloff is not the current level of the VIX, but the size of the increase and the speed with which it’s taken place, or in other words, the volatility of implied volatility.
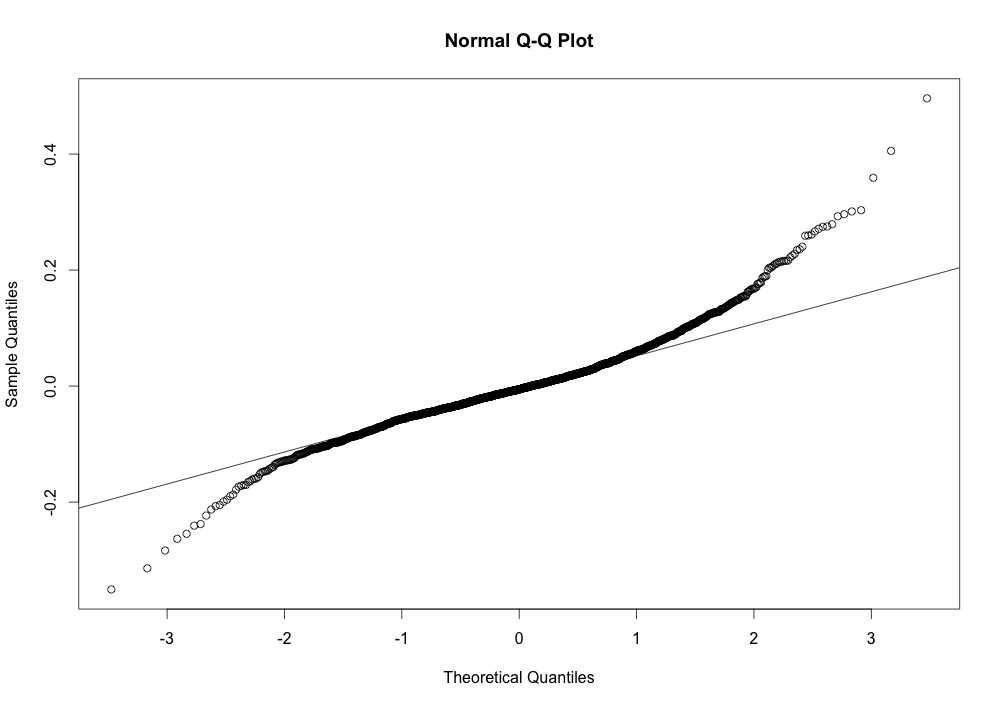
Over the past six days, the VIX has moved from 14.55 to 24.64 and is now 4.033σ above its 50-day SMA. If the daily returns for the VIX followed a normal distribution one would expect a move of this size to happen extremely infrequently. But in fact, the distribution of returns for the VIX varies quite a bit from a normal distribution, exhibiting a positive skewness of 0.7242861 and a fairly significant excess kurtosis of 3.854248. This Q-Q plot quickly shows the deviation of the distribution of VIX returns from the normal distribution. The areas on either end, where it deviates from the diagonal line, depict the long tails associated with excess kurtosis.
While still rare to see the VIX over 4σ1 above its 50-day SMA (it has only happened 9 times since 2007), it’s not quite as rare as normally expected. From a qualitative standpoint, this strong move upward in the VIX from rather anemic levels appears to imply a real concern that recent market weakness might translate into a return to higher average levels of market volatility.
| Date | VIX | SMA | Standard Deviation | Score |
|---|---|---|---|---|
| 2007-06-07 | 17.06 | 13.3520 | 0.8958248 | 4.139202 |
| 2007-07-27 | 24.17 | 15.3064 | 2.1814185 | 4.063228 |
| 2010-05-06 | 32.80 | 18.3180 | 2.9121554 | 4.972949 |
| 2010-05-07 | 40.95 | 18.7350 | 4.3233803 | 5.138340 |
| 2011-03-16 | 29.40 | 18.3332 | 2.6252381 | 4.215541 |
| 2011-08-04 | 31.66 | 19.4800 | 3.0122505 | 4.043488 |
| 2011-08-08 | 48.00 | 20.4168 | 5.2558420 | 5.248103 |
| 2014-07-31 | 16.95 | 11.8870 | 1.0645786 | 4.755873 |
| 2014-10-13 | 24.64 | 14.1808 | 2.5934461 | 4.032935 |
Footnote:
1 Chebyshev’s inequality provides a bound on the likelihood of observations greater than 4σ from the mean.
![VIX [2014] VIX [2014]](/images/2014/vix-20141013.png)
